In this chapter we will explore models that can propose and rank catalysts for a given reaction transform. The methodology uses graph-based deep learning models trained on a moderate sized corpus of very well curated reactions, each of which has the catalyst molecule (or set of molecules) drawn with a chemically meaningful structure.
This is a series of articles about reaction prediction. The summary overview and table of contents can be found here. The website that provides this functionality is currently in a closed beta, but if you are interested in trying it out, just send an email to alex.clark@hey.com and introduce yourself.
Catalyst prediction is the subject of the first content chapter because this was the main inspiration for the project. There are a number of technical background details that should probably be introduced first, but we’ll get to those in due course.
The premise is that for training data, the following information is available for each reaction:
- reactants, reagents and products, all mapped and balanced
- implied reaction transform (i.e. atoms whose environments change)
- molecular structure of the catalyst with meaningful atom/bond classes
- coarse condition parameters (duration, temperature, catalyst concentration, yield)
The model technique used to perform catalyst predictions is graph based deep learning. This is a category of neural networks where a series of input rows is allowed to influence each other based on the graph adjacency. It is sometimes called “message passing” (if you want to look it up, that term will help). For some number of convolution layers, rows are allowed to share their values with rows that are noted to be graph adjacent. Because these are molecular structures, each row is an atom, and each adjacency is a bond. Most published methods using graph neural networks are interested in assigning values to the nodes themselves (e.g. people in a social network graph) but for chemistry we’re often more interested in the properties of the molecule itself. So the trick is to describe each molecule as a block of rows (one per atom), and after the convoluting is done, sum the rows per molecule, and then pump those through a few more flat neural network layers.
The catalyst prediction model takes two graphs for each datapoint:
- the transform graph which is assembled by combining all of the reactants and products together into a single graph, marking them up based on atomic properties and transform metadata (reactant vs. product, distance from transform), and faux bonds to represent the atom-to-atom mappings
- the catalyst graph which is the molecular structure of the catalysts (or more than one, if it’s a precatalyst/ligand combination); the atomic charges and bonding are assigned using the DotPath representation, which provides homogeneity and proper symmetry distribution for complicated inorganic bonding patterns
For the output score, one option would be to use the yield of the reaction, but as various practitioners have found, this isn’t great for reactions. The available data tends to be heavily skewed in favour of higher yielding results. There is a trick that can be played to improve the spread and establish a gradient within reactions that have similar final yield results, and that is to take account the fact that the degree of excellence for any particular catalyst could crudely be said to depend on these antagonistic characteristics:
- yield (obviously)
- catalyst concentration: achieving compatible yield with a smaller amount is better
- duration: shorter time is better
- temperature: injecting less external energy into the reaction is better
Collectively these can be made to indicate that a good catalyst works harder to get it done with a higher success rate and less energy input. With a little bit of effort a formula can be composed to generate a ranking score which splits out the catalysed reactions within a training set somewhat evenly, and can distinguish between good, bad or mediocre catalysts, even when yields are high.
A model using graph neural networks (transform + catalyst) to predict the composite ranking score trains well. With training data sizes varying from about a thousand cases (at the beginning) to just under ten thousand (now), an R2 value of ~0.9 can be achieved for the test set by running it overnight on a commodity nVidia graphics card, encapsulated in an entry level gaming computer. The difference in training time between CPU and GPU is pretty wild, but at this scale, there is no need to escalate to expensive hardware.
The training platform uses Python/PyTorch, mainly because it has very good GPU support. All of the tools that involve applying the model are coded up in Java, which reads the same datastructure as used by the Python library, and recreates the matrix/vector multiplications and graph convolutions. All of the data preparation steps use the same Java-based toolkit. These are where most of the action happens: the network construction and training is quite concise from a lines of code point of view.
The kind of data that goes into the training set looks like this:
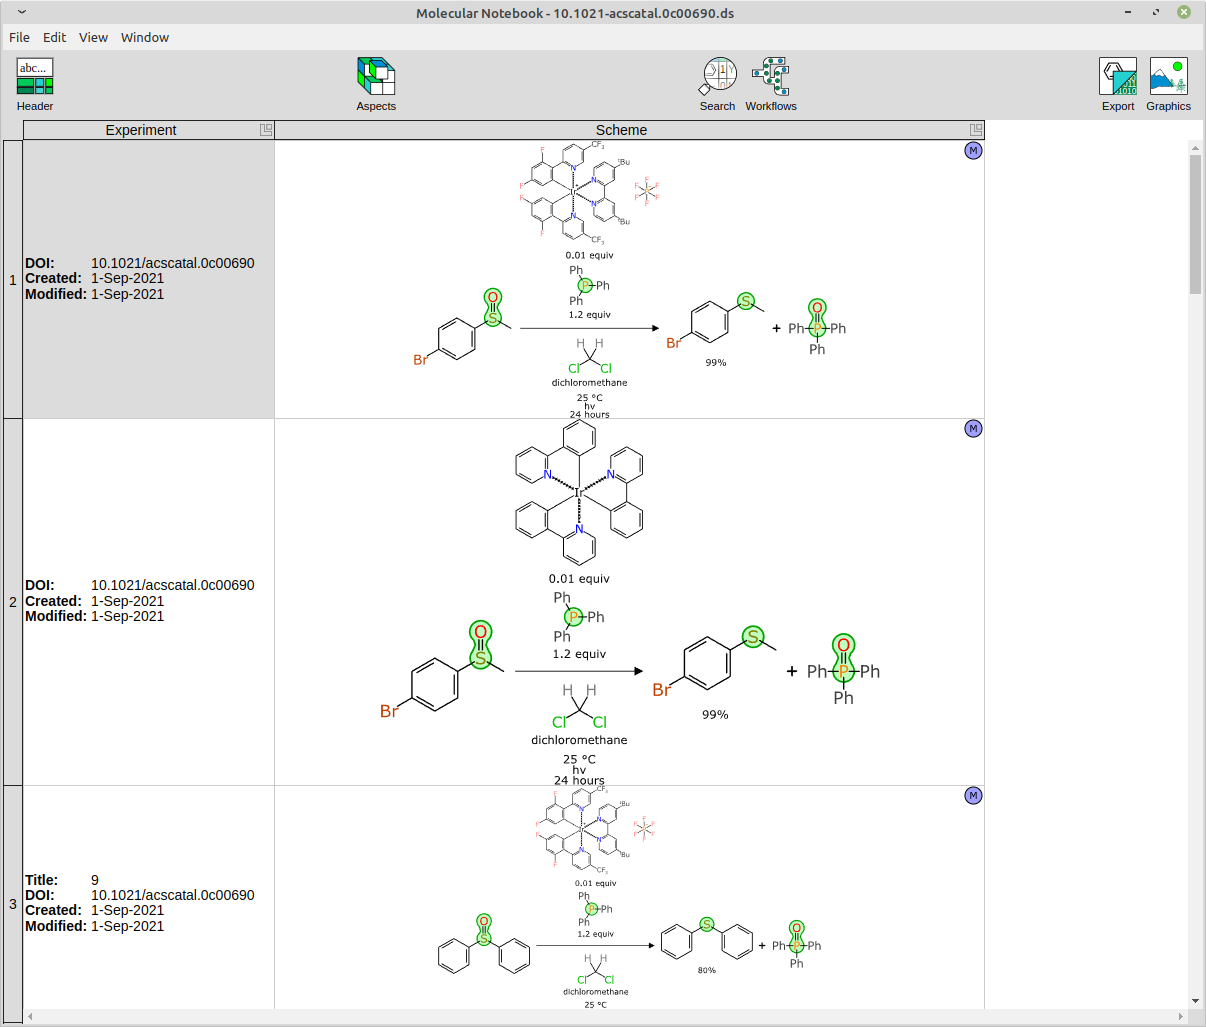
Note that each row has a literature reference, structures for all of the reacting components and non-stoichiometric adjuncts, roles for everything, clearly defined reaction transform, byproducts included, and high level reaction conditions. These are the data objects that get pushed through the meatgrinder to emerge as tensors for the neural network training.
When applying the model in a real world workflow context, the content available to be fed in is less complete. The screen capture below shows what happens when we feed in a basic reaction scheme, and ask the web service for advice:
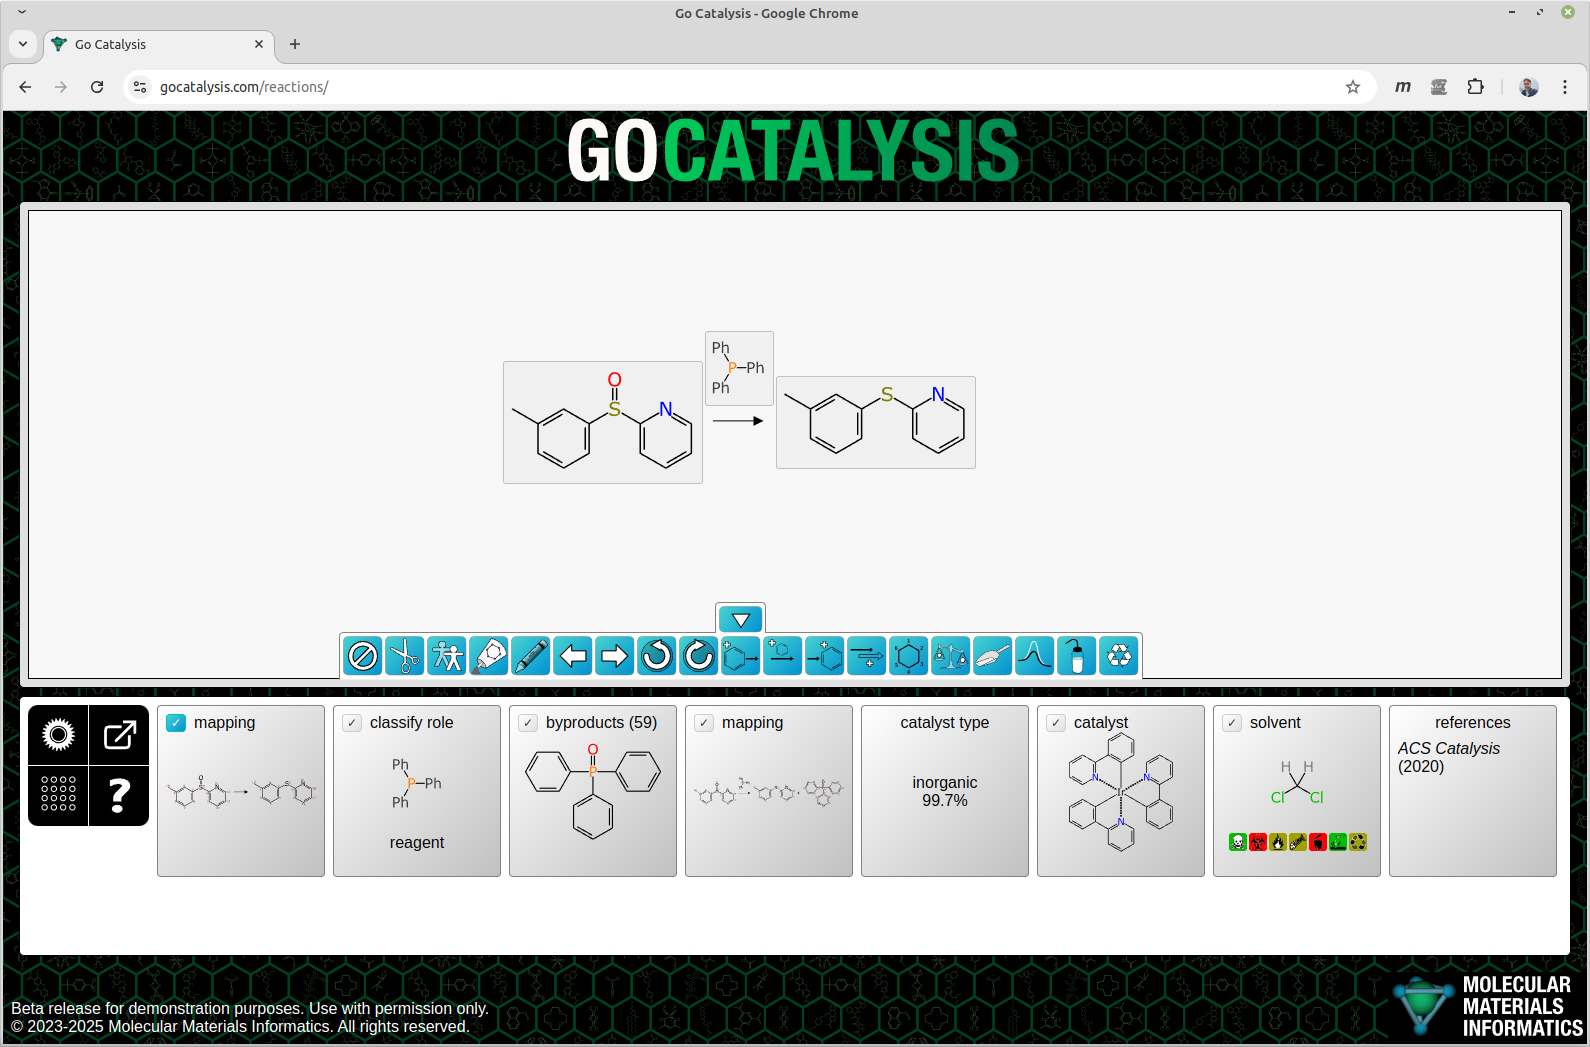
There is a lot going on in the figure above, so let’s establish first of all that we are jumping in right at the middle here. There are a number of actions that happen before the catalyst prediction, and I will describe them in later articles. The reaction engine takes the basic input from the user – which in this case is one reactant, one reagent and one product. It grinds through several preparation steps, and these can be seen in the cards that are arranged from left to right under the scheme: atom mapping; ascertaining that the triphenylphosphine shown above the arrow is in fact a stoichiometric reagent rather than some kind of bystander; and proposing a most likely byproduct.
The internal workflow is quasi-linear, in the sense that there is an ordered sequence of steps, but some of these steps may have more than one option. Each of these multiplicities is ranked, and so it picks the best one, and proceeds to the next step. If you’re feeling lucky, you can just keep clicking on the turquoise checkmark button on the left and apply the best results in the same order. But at any point you can view the list of options and make your own decision, taking into account the model’s recommendation:
As it happens, there are actually two deep learning models for catalysts: a secondary model is used to predict whether a given reaction transform is best served by an inorganic catalyst, or an organic catalyst, or no catalyst at all. The last category is rather important: a service that insists on recommending catalysts for reactions that don’t need one would be annoying to the point of being unusable.
When it comes to deciding which catalysts to rank, there is a prefilter to address the fact that the training data is made up of less than ten thousand datapoints that covers a truly vast space of possible reaction transforms and catalyst structures. In order to stay within domain, the algorithm computes a hash code for the reaction transform, and cross references the training data, pulling out a unique list of catalyst structures that have been observed for that reaction transform. This constraint is a strong reality check, at the expense of being able to nominate true novelty. In the long term this may be relaxed or dismissed as the training data grows.
Some common reaction types have quite a few available catalysts:
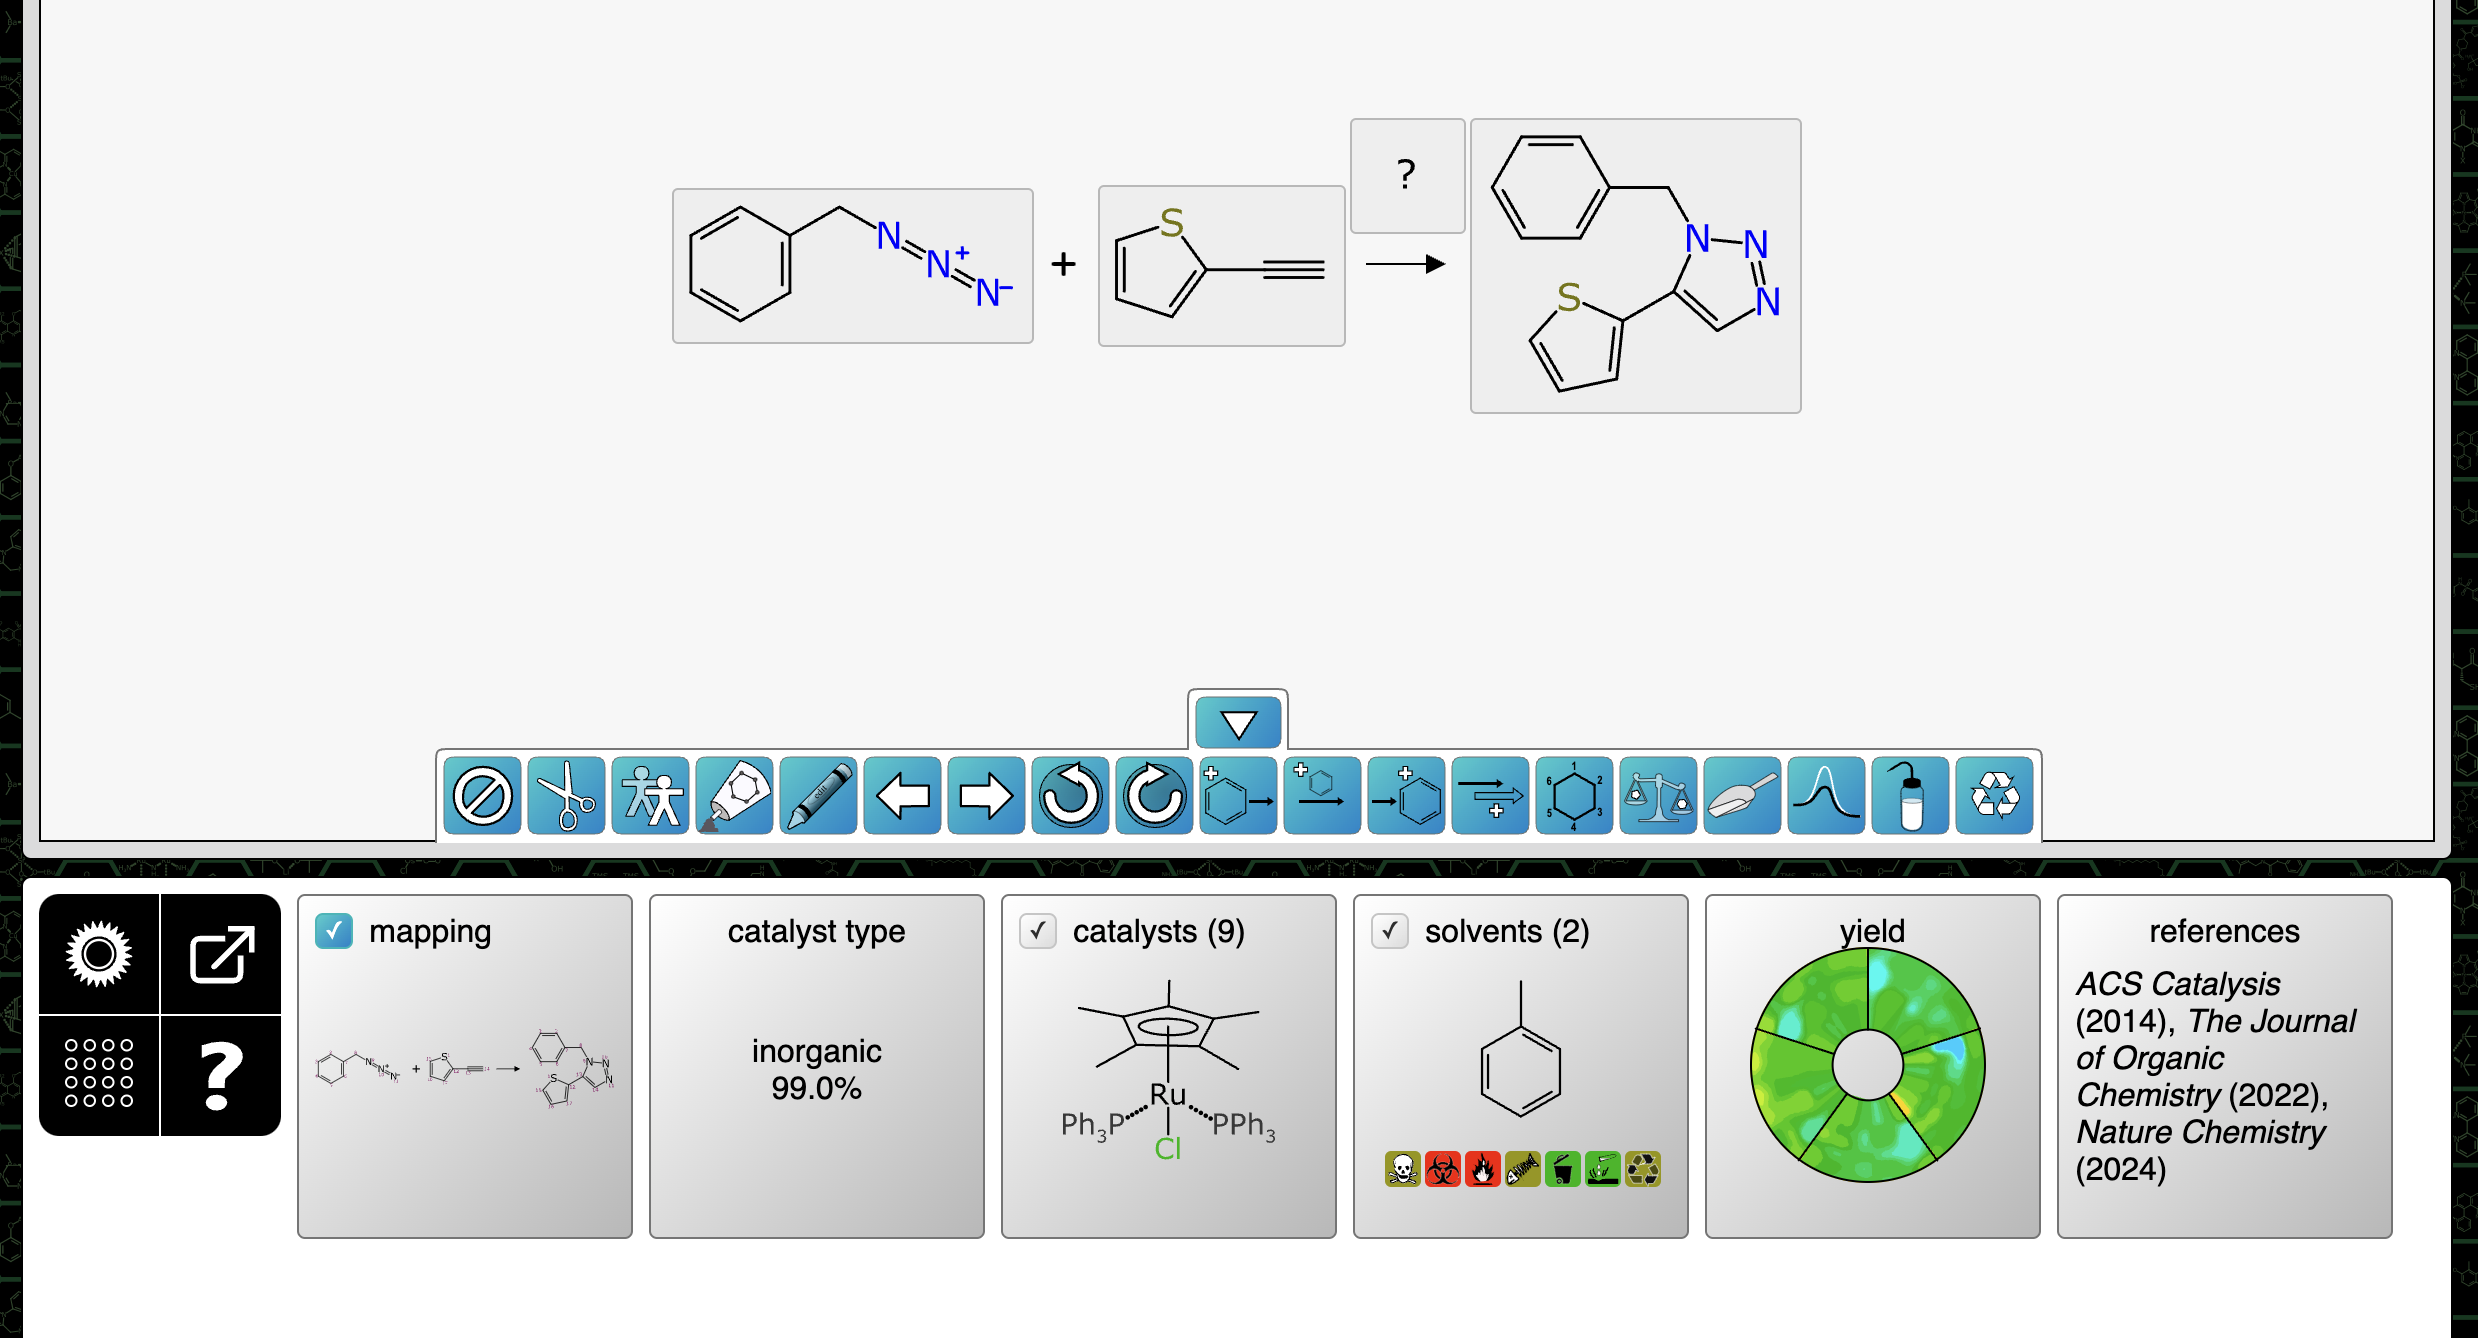

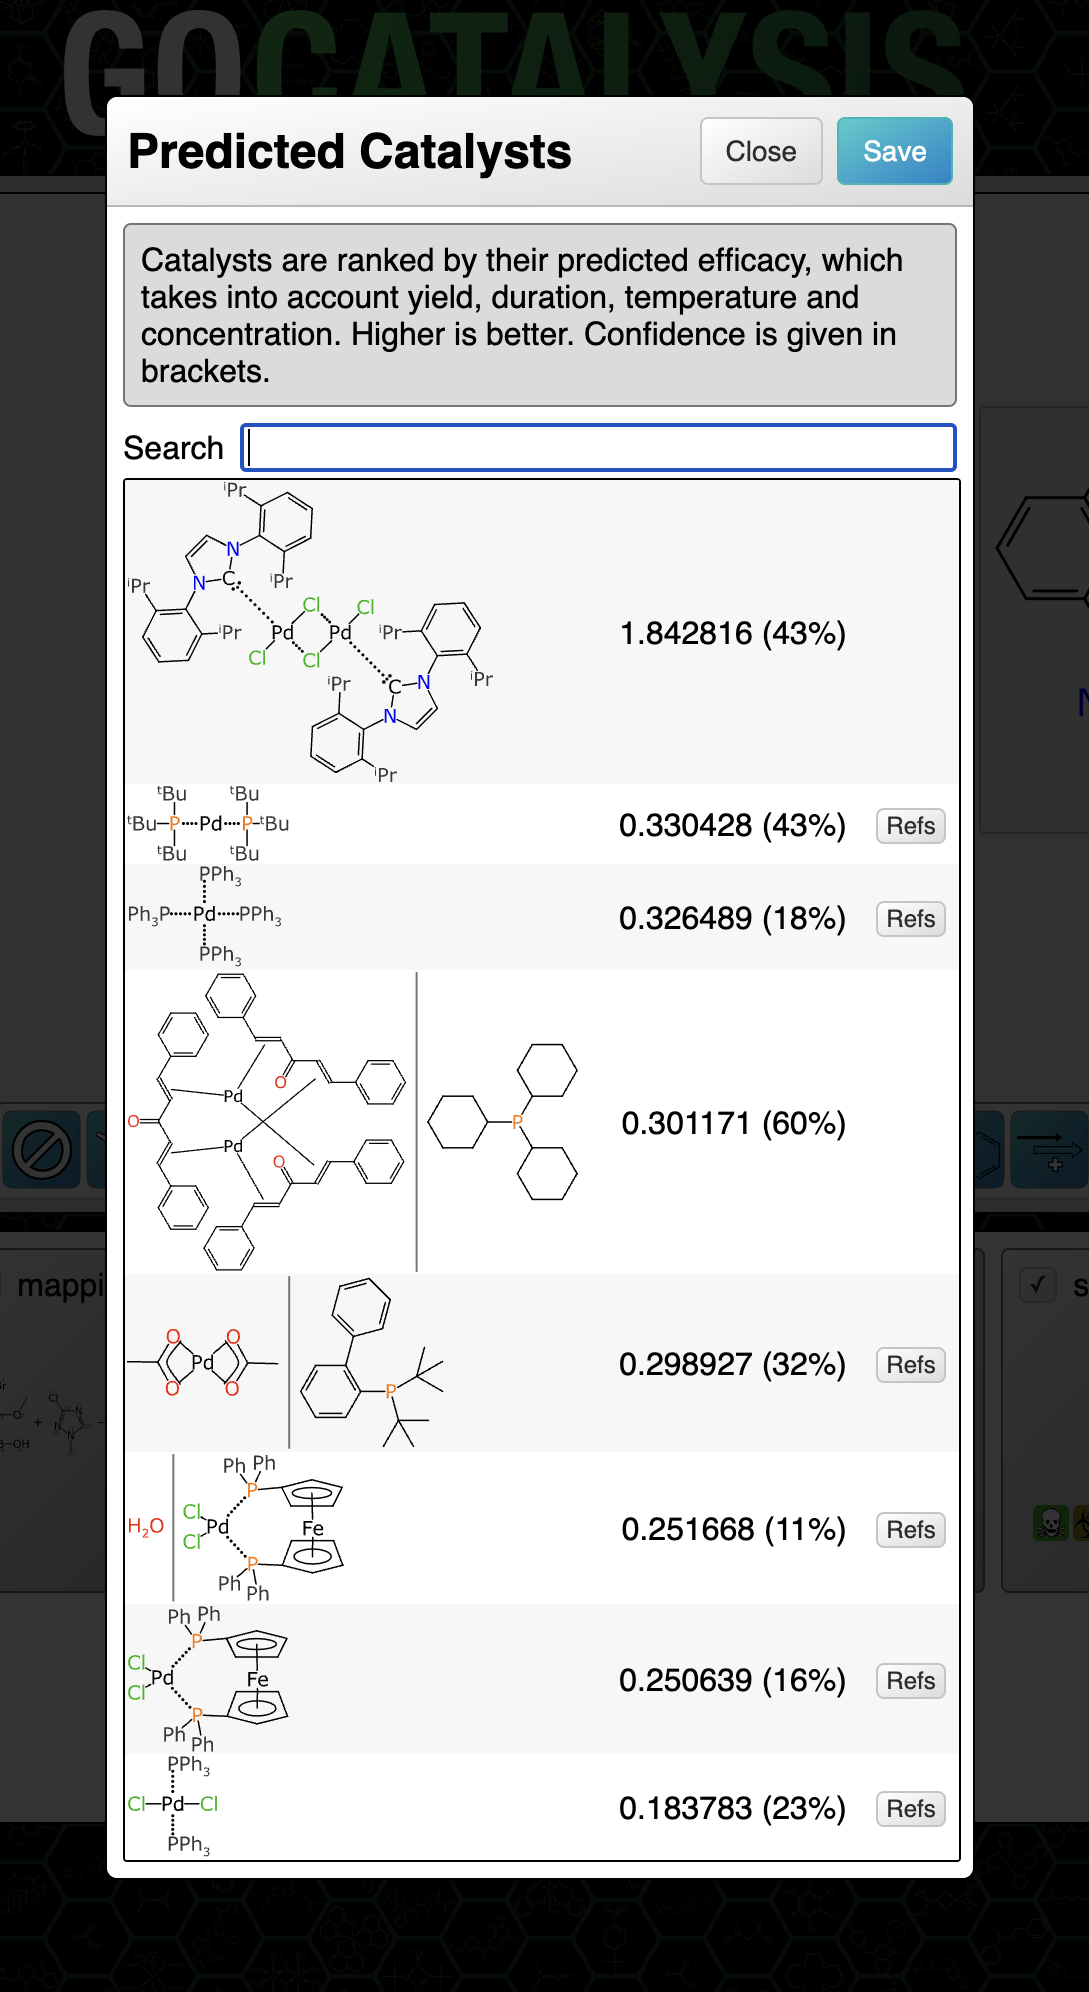
Clicking on the catalysts panel brings up the list. The highest ranked catalyst is shown first. There are a few things to note about the dialog box in the figure above:
- the main number is the composite prediction score (while it could be decomposed into real meaning, consider it to be an arbitrary scale)
- the percentage in brackets is a confidence measure (more about this in a later article)
- there is a little button for each one entitled Refs, which gives you links that you can lookup to use as a reality check, in the event that you have a healthy degree of scepticism for anything that comes from a model
- the structure diagrams include features like arene bonds and dotted bonds for those which don’t follow the simple organic bonding pattern rules
- the second entry has a vertical bar separating two structures: this is the notation used when the catalyst is actually a precatalyst + ligand combination, which is very common
That’s the catalyst prediction in a nutshell. The next article describes prediction of solvents, which follows a very similar pattern.
