In this chapter we will explore models that can propose and rank solvents for a partially specified reaction. The methodology uses graph-based deep learning models trained on a moderate sized corpus of very well curated reactions with each of the solvents represented as a chemical structure.
This is a series of articles about reaction prediction. The summary overview and table of contents can be found here. The website that provides this functionality is currently in a closed beta, but if you are interested in trying it out, just send an email to alex.clark@hey.com and introduce yourself.
The previous article described using models to propose catalysts for chemical reactions. The technology and workflow for proposing and ranking solvents is very similar. Just like for the catalyst models, the premise is that for training data, the following information is available for each reaction:
- coarse condition parameters (duration, temperature, yield)
- reactants, reagents and products, all mapped and balanced
- implied reaction transform (i.e. atoms whose environments change)
- molecular structure of the solvent(s) with meaningful atom/bond classes
Like with the catalyst models, the inputs are formulated as labelled graphs. One of the differences is that it is generally assumed that while you are putting together a reaction plan, you will decide which catalyst (if any) to use before selecting a solvent. This is justified by the fact that catalyst solubility is an important detail, and you’re more likely to pick a solvent that is compatible with your preferred catalyst than the other way around.
For this reason, there are three graph inputs that are fed into the solvent model:
- the transform graph
- the catalyst graph
- the solvent graph
The output property is a single number that is built out of reaction conditions and yield. However unlike for the catalyst models, which use catalyst loading as a factor, the quantity of solvent is not included in the composite score. This is potentially justifiable on a scientific basis, but the reality is that much of the training data does not include this information. Therefore the efficacy of a solvent is made up from:
- yield (higher is better)
- duration (shorter is better)
- temperature (colder is better)
Similarly to the fact that many catalysts are expressed as multiple materials (precatalyst + ligand), use of multiple solvents is very common. For multi-solvent reactions, these are treated as single molecule for training and prediction, and then split back out into multiple solvent components when applied to a reaction.
Recognition of solvents within the training data is based on automatic recognition of common solvents, or explicit tagging of component role. There are only a few dozen really common solvents in use throughout chemistry: most chemists are incentivised to select a substance that is liquid at room temperature and available for cheap in large quantities. Most of the entries in the training data confine themselves to the common list, although there is the occasional novel example.
Training the deep learning models for solvent ranking, using ~10K datapoints, can be done overnight on an entry level GPU. The R2 metric for the test data tops out at around ~0.7, which is significantly lower than the catalyst model. The lower performance was probably initially confounded to some extent by the fact that initial training data was chosen to explore structure-activity properties of catalysts, with the solvent not being the focus of optimisation. Training metrics have improved slightly as more data has been added with the purpose of providing more diverse solvent options. The persistent lag behind catalyst models is probably due to the fact that there are far fewer interesting graph features to latch onto compared to catalysts (e.g. the difference between the connection tables of ethanol and tetrahydrofuran is much less profound than that of any pair of exotic coordination compounds). More training data is gradually pushing the performance upward.
Proposed solvents for any given reaction use the same strategy as for the catalyst models: all examples of solvents that have been observed in the training set for the same reaction transform are considered fair game, and are proposed and ranked accordingly.

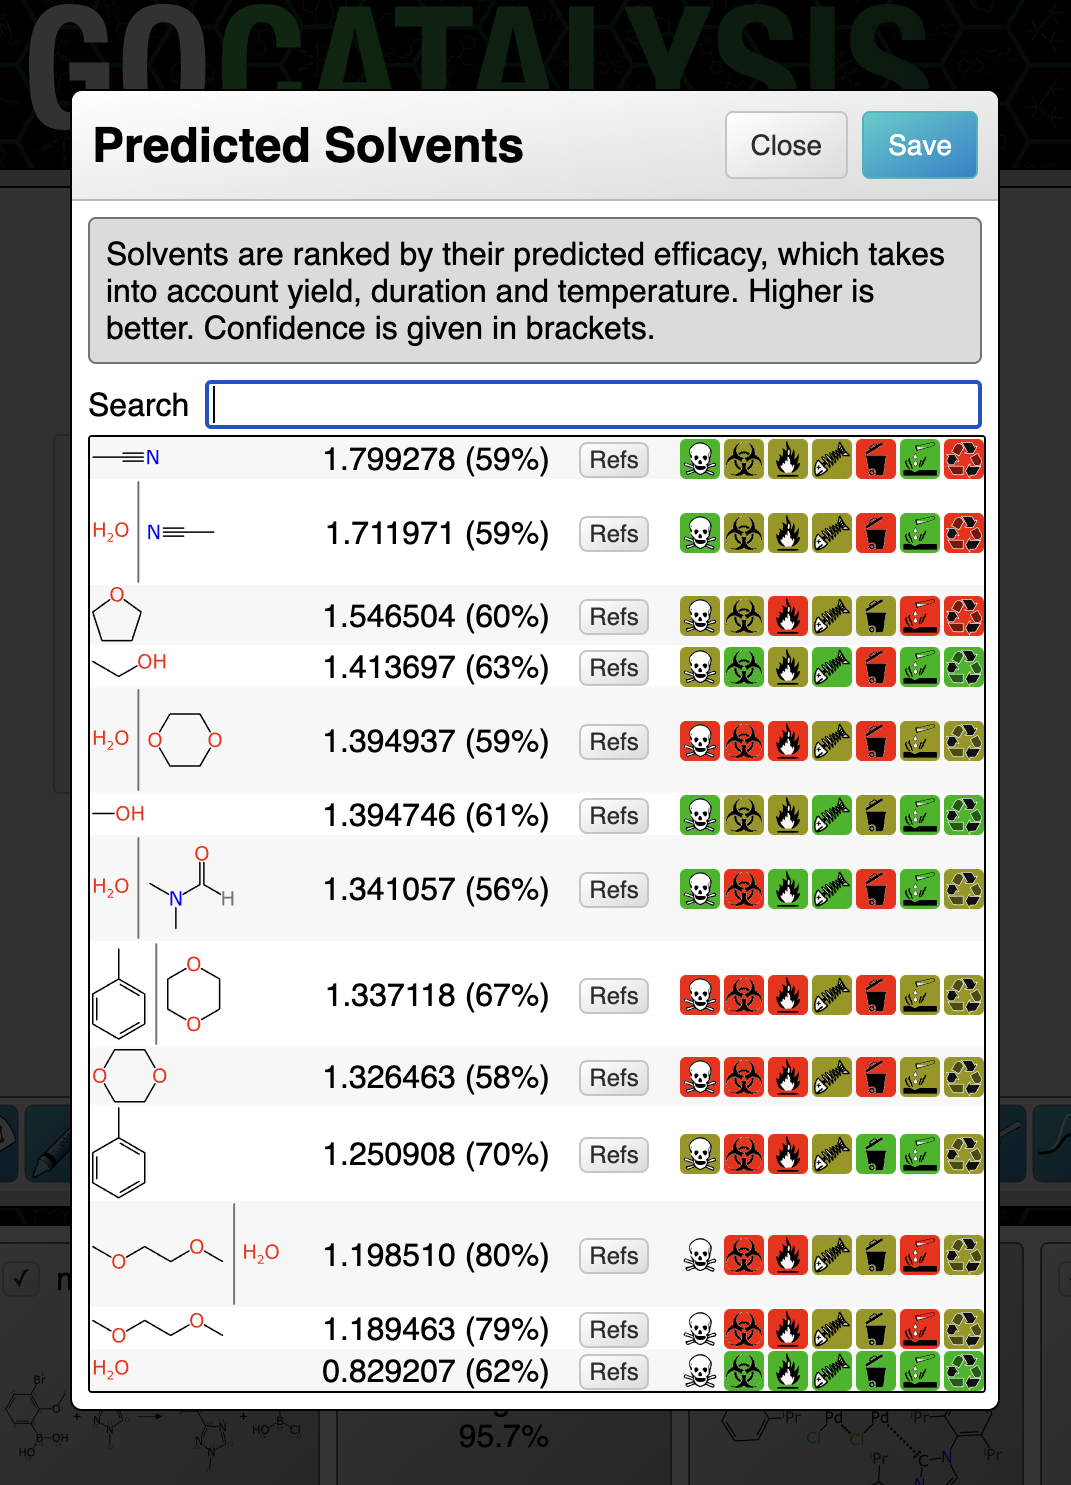
The screenshot above shows the predicted solvents for a partially specified coupling reaction. Note that because catalysts are proposed first, the solvents are fed into the model based on the assumption that the highest ranking catalyst has been selected. The list will be recomputed and re-ranked if a different solvent is chosen.
The highest ranking catalyst involves an iridium compound of the kind that is very soluble in dichloromethane. I must have personally used many cubic metres of the stuff during my graduate research years, and the landfill will not thank me, but it is excellent and hard to replace. So it is not surprising to see that the solvent model picked this and pushed it to the top, by a considerable margin.
If you observe the scary looking icons on the right hand side of the selection list, it’ll try to nudge you in the direction of solvents that cause fewer problems – although in this case, it looks like the other leading contenders aren’t much more friendly.
The percentage shown in brackets after the ranking score is an indication of confidence. These numbers are all low, which is indicative of either poor domain coverage of one or more parts of the reaction definition, or a tendency that particular solvent to have a high margin of error. Prediction confidence is what we will cover in the next article.
