Prediction models for proposing and ranking catalysts and solvents are all very well, but some predictions are more reliable than others. Coming up with some kind of metric for evaluating the difference is a major improvement to utility.
This is a series of articles about reaction prediction. The summary overview and table of contents can be found here. The website that provides this functionality is currently in a closed beta, but if you are interested in trying it out, just send an email to alex.clark@hey.com and introduce yourself.
Anyone who has built a model of any kind is familiar with the idea of having a metric that indicates how well the model reproduces its own training data, as well as a set-aside collection of testing data that is nominally independent. Quite often the metric used to guide the model building will be quite interpretable (e.g. the Euclidean distance to the factual reference, or the closely related mean squared error) and there are many others, such as the popular R2 metric. All of these commonly used metrics have one thing in common: they apply to the whole model, not to one particular prediction.
When it comes to finding methods to determine an error metric for an individual datapoint, the internet is uncharacteristically quiet. There are some easy to find articles that will solve this problem for you if you have a single descriptor, but for multidimensional regression of any kind? Answers are absent or well hidden. And I have asked several experts on the subject, who were unable or unwilling to point me to anything actionable.
Upon thinking about the problem for some time, I reduced the scenarios for model-based prediction to three category archetypes:
- the input parameters fall into an area that is dense with training data, and the correlation between parameters and outputs is strong
- the area of parameter space has adequate proximity to training data, but for whatever reason the model does not perform well in that region
- the parameter space is quite far out of the training domain, causing predictivity to be poor
I ruminated upon various ways to make a model of the model, but in the end the approach that captivated me was to revisit a relatively low-tech approach: Bayesian inference. In particular the specific subspecies called Laplacian corrected naïve Bayes. This is a fancy way of saying that instead of just adding up the ratios of priors, you add up the ratios using the log function. It makes the method feasible using thousands of priors, at the expense of discalibrating the output result, which is no longer a probability, but instead has to be transformed by deriving a post-correction.
This flavour of Bayesian model has been very useful for predicting activity in drug discovery, often paired with the ECFPx (aka Morgan) fingerprints. As long as you can reduce your output result to a yes/no binary, then the priors (or fingerprints in this context) have the following priorities:
- if the fingerprint is present in a very large fraction of positive cases, it has a high additive effect
- if the fingerprint mostly observed for negative cases, it has a low additive effect
- if the fingerprint is not observed in the training data, it has no additive effect
The three bullet points are not coincidently related to the list of archetypes further above. As long as the fingerprints capture the composition of the inputs in a similar way to the model proper (i.e. using fingerprints derived from chemical structures as an analog of the neural network hidden layers derived from the chemical graphs) then they are comparable.
For the catalyst and solvent models separately, the output binary was taken to be: for each entry in the training set, the outcome is considered positive if the prediction is within 0.1 of the actual score (which is itself has an operating range of 5-10). The rest are considered to be negative, i.e. poor predictions. Note that these kinds of Bayesian models often predict really well if you set the bar rather high, as long as you don’t exclude the high value fingerprints.
For input priors, recall that the catalyst and solvent models feed in the graph of the chemical reaction transform, and the graph of the molecular entity of focus (i.e. catalyst or solvent respectively). For each of these, a variation on the ECFPx fingerprints is used. Transform fingerprints use a composition that builds atom starting values for each of the reactant/product atoms that takes into account their side and proximity to the atoms-of-change within the reaction, while catalyst fingerprints use a DotPath-based initial classification for atom environments, which is invariant to decisions about complex bond assignment.
The two Bayesian models (for catalysts and solvents) are invoked along with each ranking prediction, and displayed as a percentage in brackets:
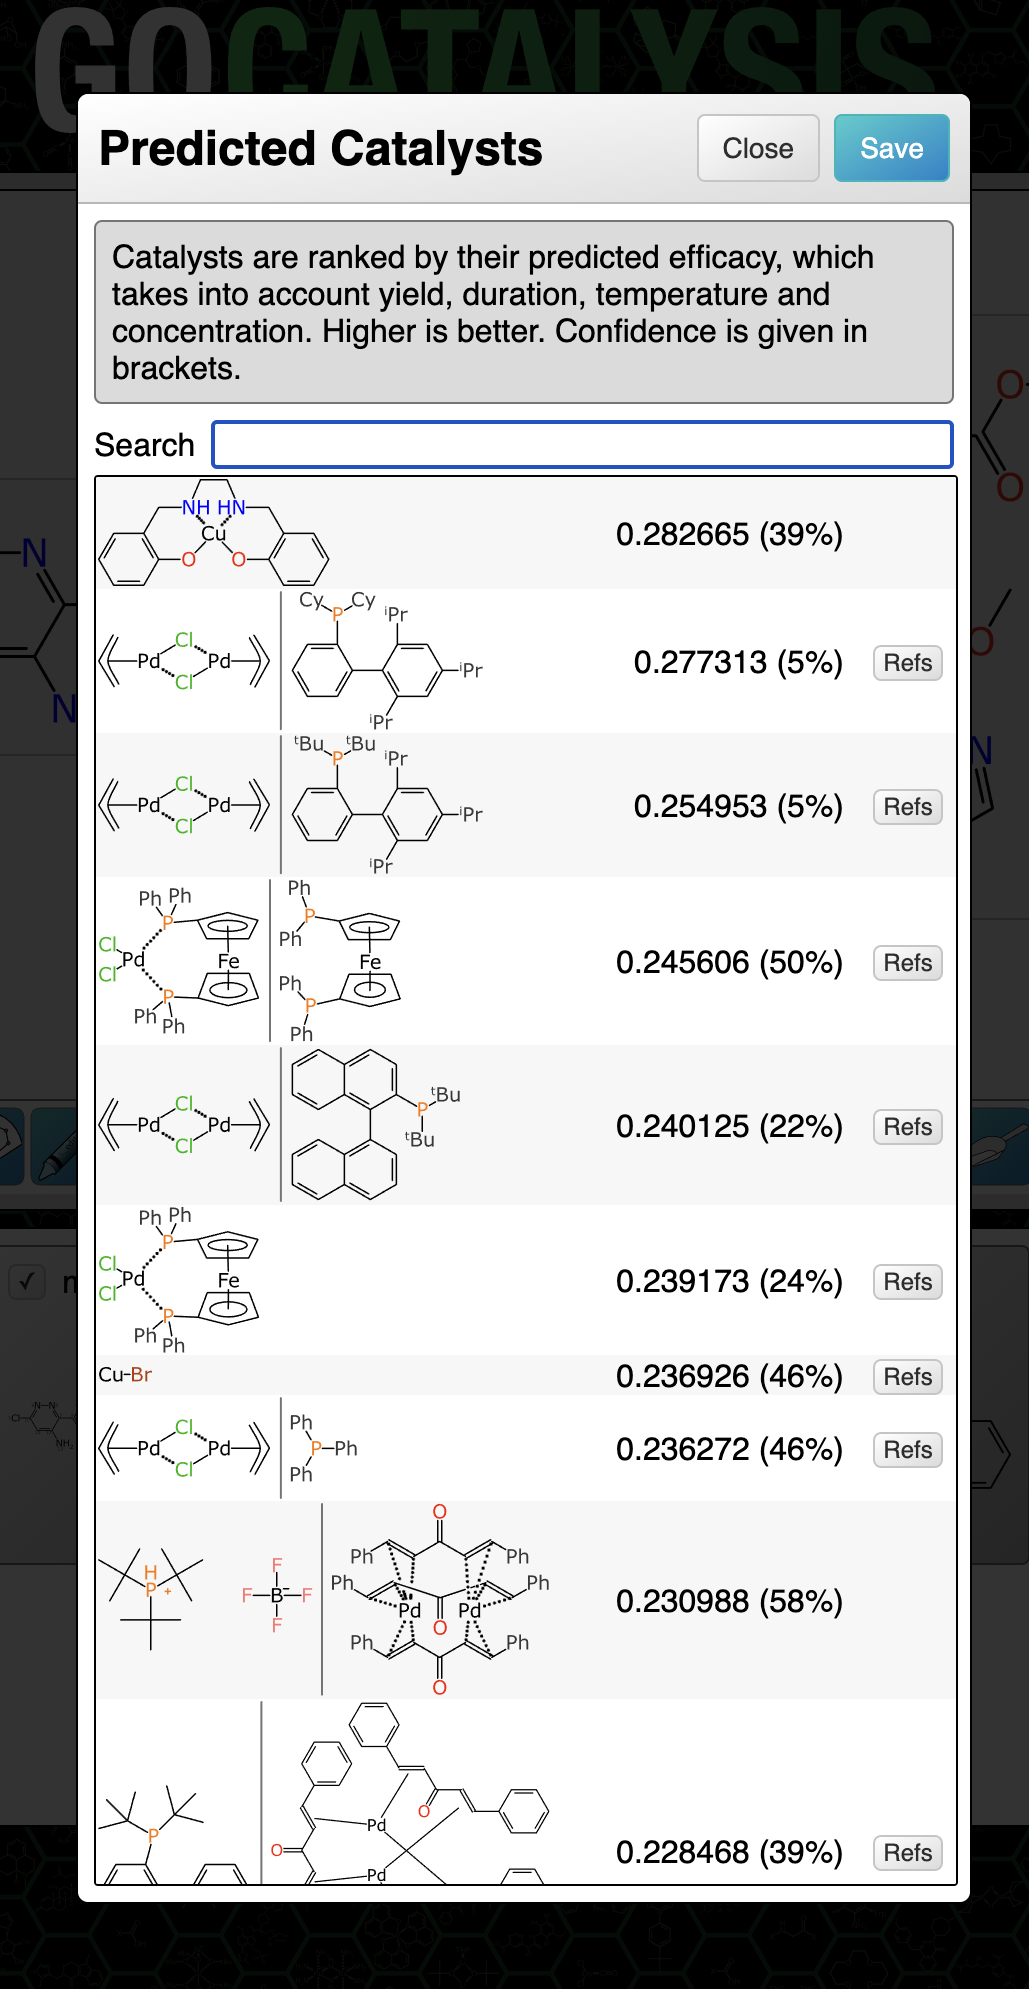
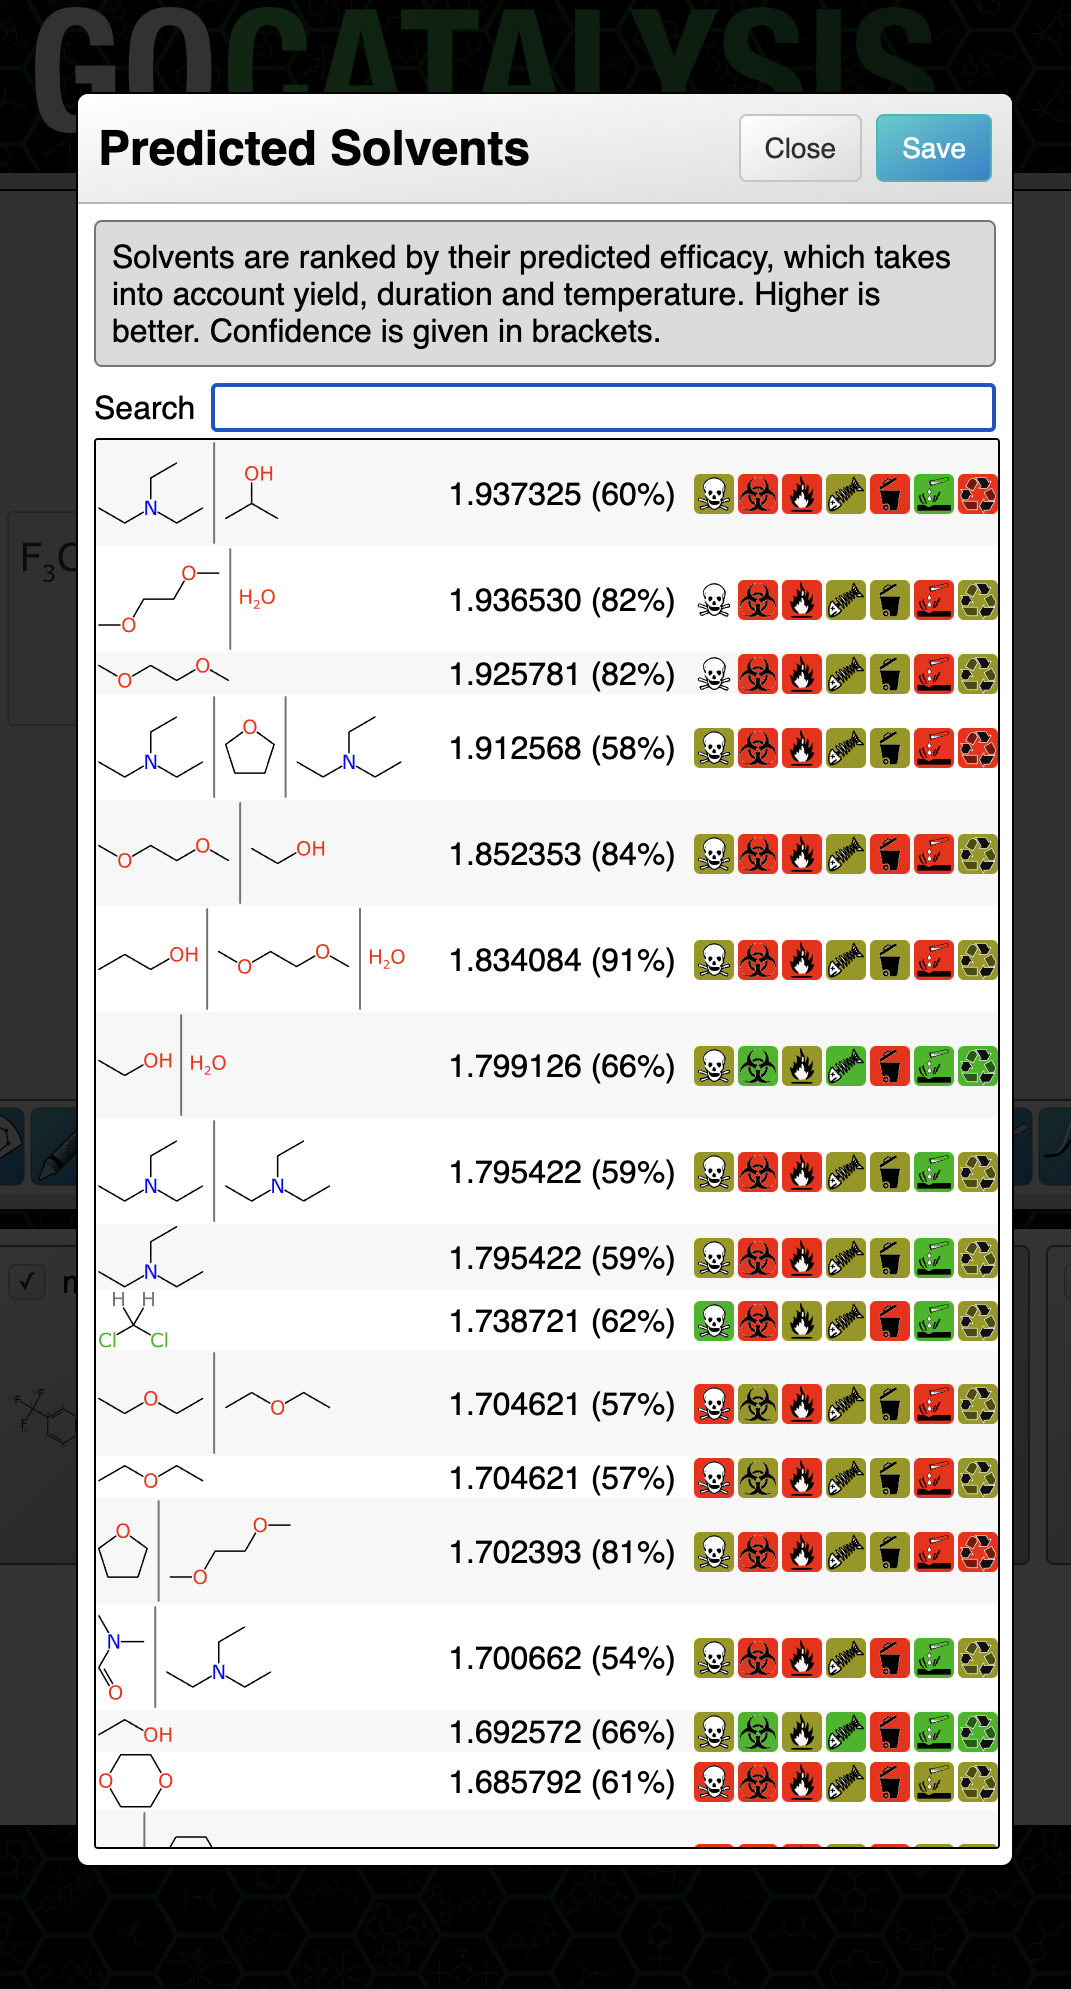
The way to think of the confidence metric is: the probability that this prediction is really likely to be what it claims to be (whether that’s high, medium or low). If the confidence percentage is low that doesn’t necessarily mean it’s a bad prediction or that it’s not helpful, it just means that the outcome can’t be backed up by a lot of evidence that it occurs within a dense closer of training data for which the results are consistently in high agreement with the experimental facts.
Is this the most rigorous way to calculate confidence? Probably not – but it makes sense, it’s derived from an independent methodology with minimal circular reasoning, and I can argue that it’s a lot more useful than just a prediction with no further qualifications.
The next chapter in the series describes prediction of byproducts, mapping, balancing and roles.
