
The reaction editor described in these articles can read & write a number of different formats, which means it does not exist in isolation. Reactions can be exported using informatics formats or as publication-ready presentation graphics.
This is a series of articles about reaction prediction. The summary overview and table of contents can be found here. The website that provides this functionality is currently in a closed beta, but if you are interested in trying it out, just send an email to alex.clark@hey.com and introduce yourself.
The preceding articles in this series have described the steps needed to build up a complete definition of a reaction scheme with substantial machine learning support. There are scenarios where it is quite sufficient to merely display the scheme onscreen, but if it is something genuinely useful it helps to be able to pass it along to someplace else.
For purposes of getting content out, there are a bunch of formats to choose from. These correspond to the Format option buttons in the dialog shown above, plus the native internal DataSheet/Aspect format (which isn’t in the export dialog because you can get it with the Copy action). The two formats covered in this article are the purely graphical representations (SVG and PNG). We will cover use cases for the two supported canvas-based reaction formats (ChemDraw and Ketcher) in subsequent articles.
The setup process for creating graphics allows several options to be configured: the scheme can be monochrome or colour, and composed for either light or dark background. The amount of information shown in the picture can be selected with toggles (e.g. whether or not to include component names, mapping numbers, and such things).
In terms of container formats for graphics, there are three main ones that provide good interoperability with the presentation tools that most people have available:
- PNG: portable network graphic, the web’s most popular raster (or bitmapped) format. Raster formats are the easiest for third party tools to support, because each one is a matrix of coloured dots, shoehorned into a file format that provides some degree of data compression. The compatibility is excellent, but the down side is that you need to choose a resolution when you generate the image. If you select a pixel density that is too high, your files will be large, and pushing it across the internet will be slow; if you pick a density that is too low, your powerpoint slides and web pages will look great on a cheap monitor, but like garbage when you print them out.
- SVG: scalable vector graphics, the most well standardised but not necessarily most well supported vector graphics file format. Vector graphics is the perfect match for molecular diagrams because they are composed of very basic shapes such as lines, circles and paths, which are encoded directly into the file format. The chemical graphics output is concise and scales to any resolution, so it looks great whether it’s showing in a screen thumbnail or a full size printed poster. SVG files have the benefit of being slightly human readable, since it is an XML-based format.
- PDF: portable document format, not currently supported in the web incarnation, but it likely will be sometime soon. The PDF format is usually encountered for multipage documents, but it happens to be also a rather effective way to capture figures and embed then in presentations. Using the PDF format for figures is conceptually similar to using SVG, with the main benefit being better software support, traded off against being much harder to edit.
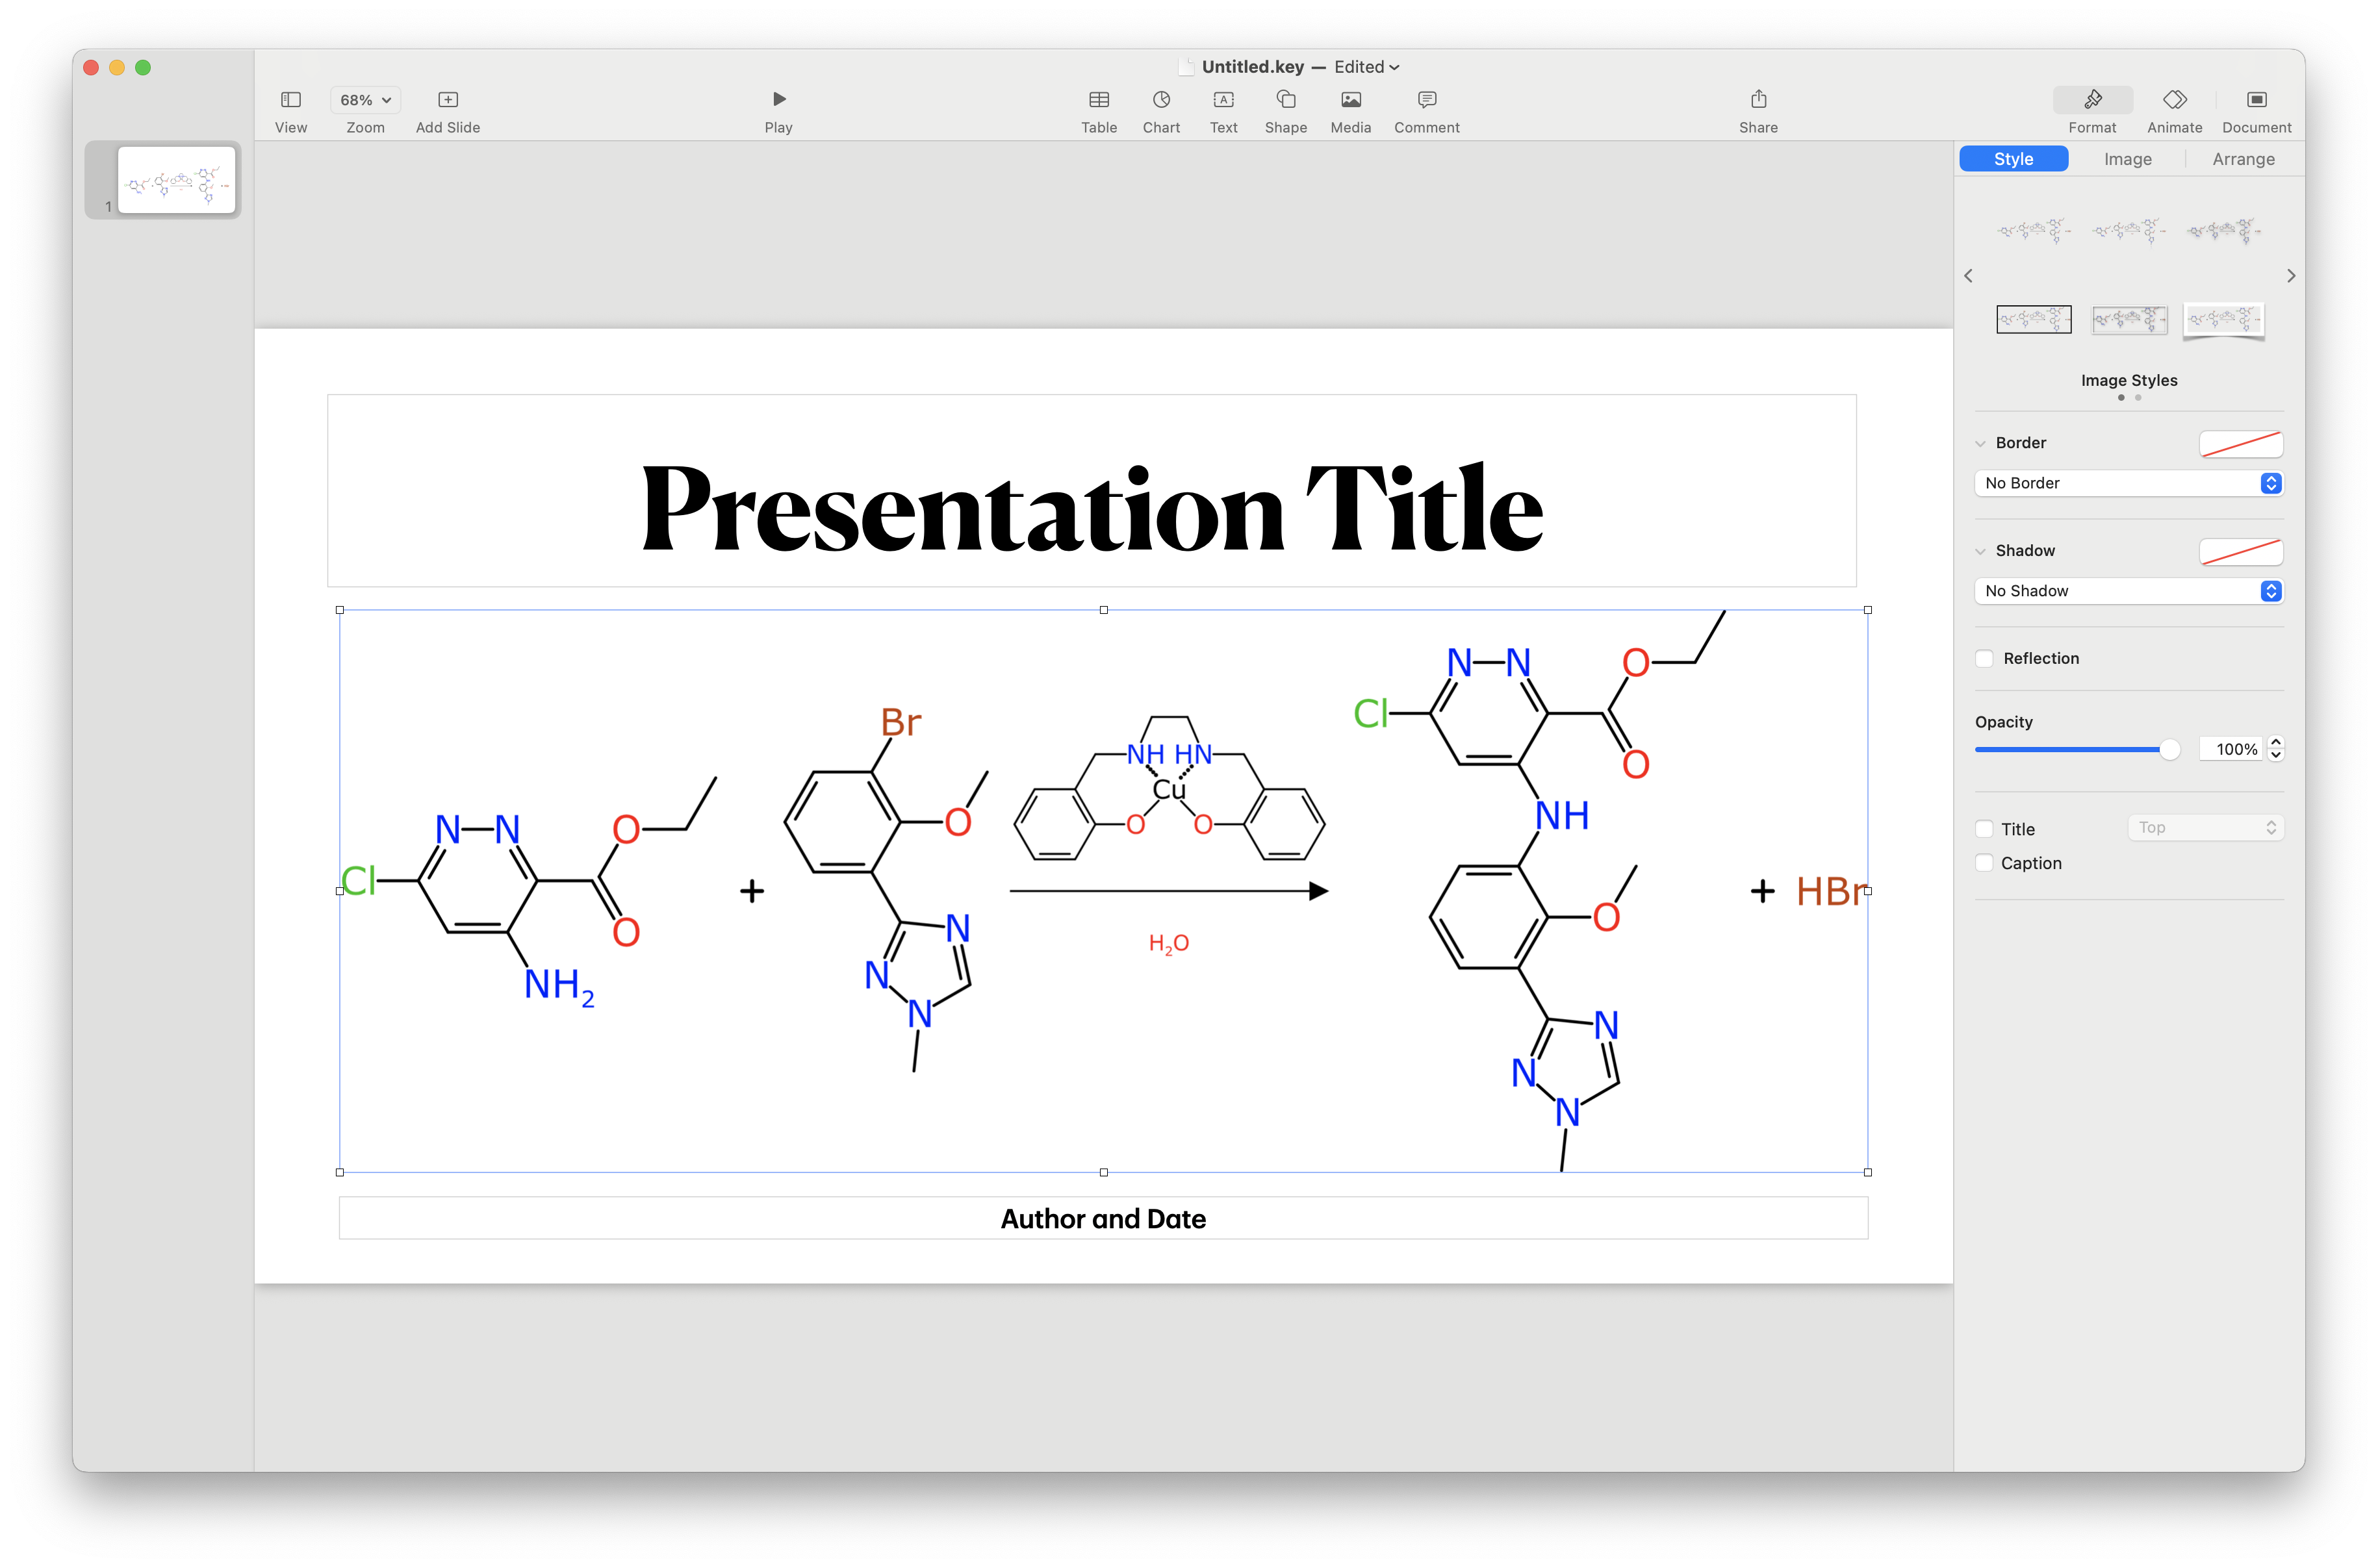
The web tool allows exporting to be done either via the clipboard or by saving to a file. Using the clipboard is the most convenient way of getting the image of the reaction into a presentation tool. For example, copying the PNG image into Keynote (which you probably have if you use Apple products):
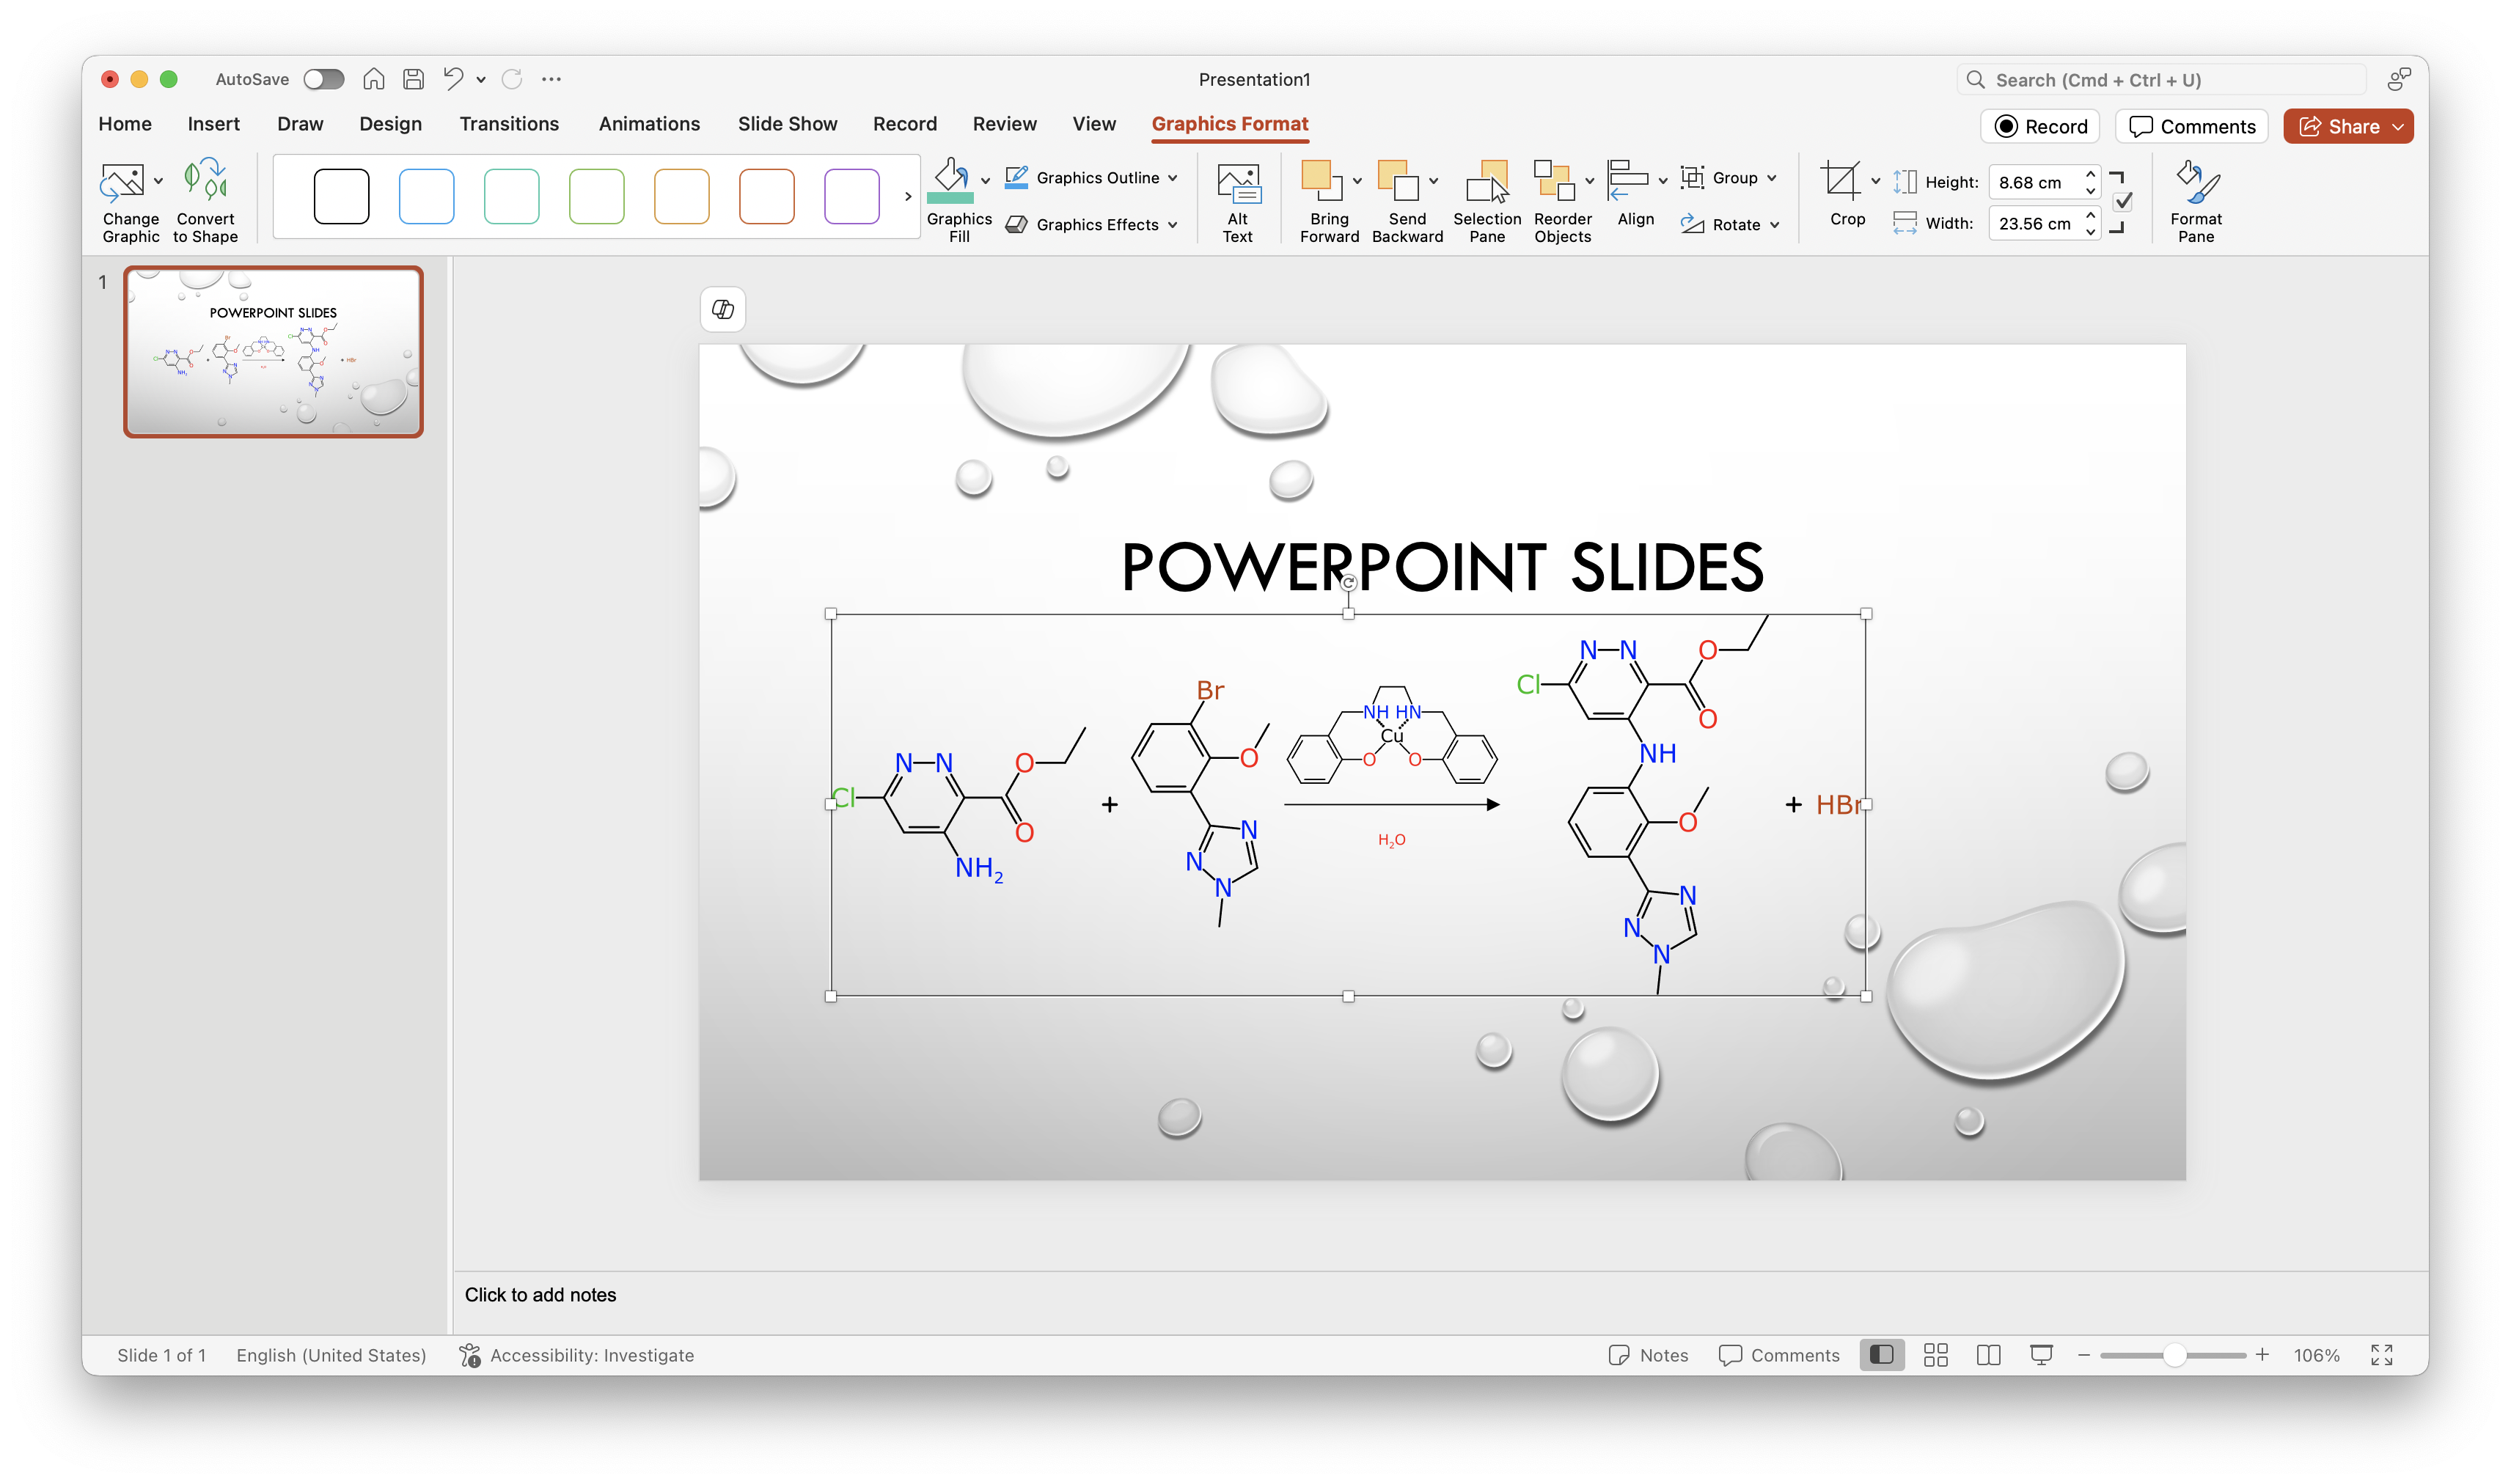
If you are a user of PowerPoint, you can use the SVG format: while pasting the content via the clipboard doesn’t work, saving the file then dragging it in achieves the desired effect:
One of the nice features of SVG is that there are open source editors that can let you edit the exported diagram (or a plain text editor, if you are brave). My own personal favourite is Inkscape, which wraps some incredible functionality inside a rather hostile user interface, but it is available for every desktop OS and also works on the command line.
Editing the reaction scheme looks something like this:
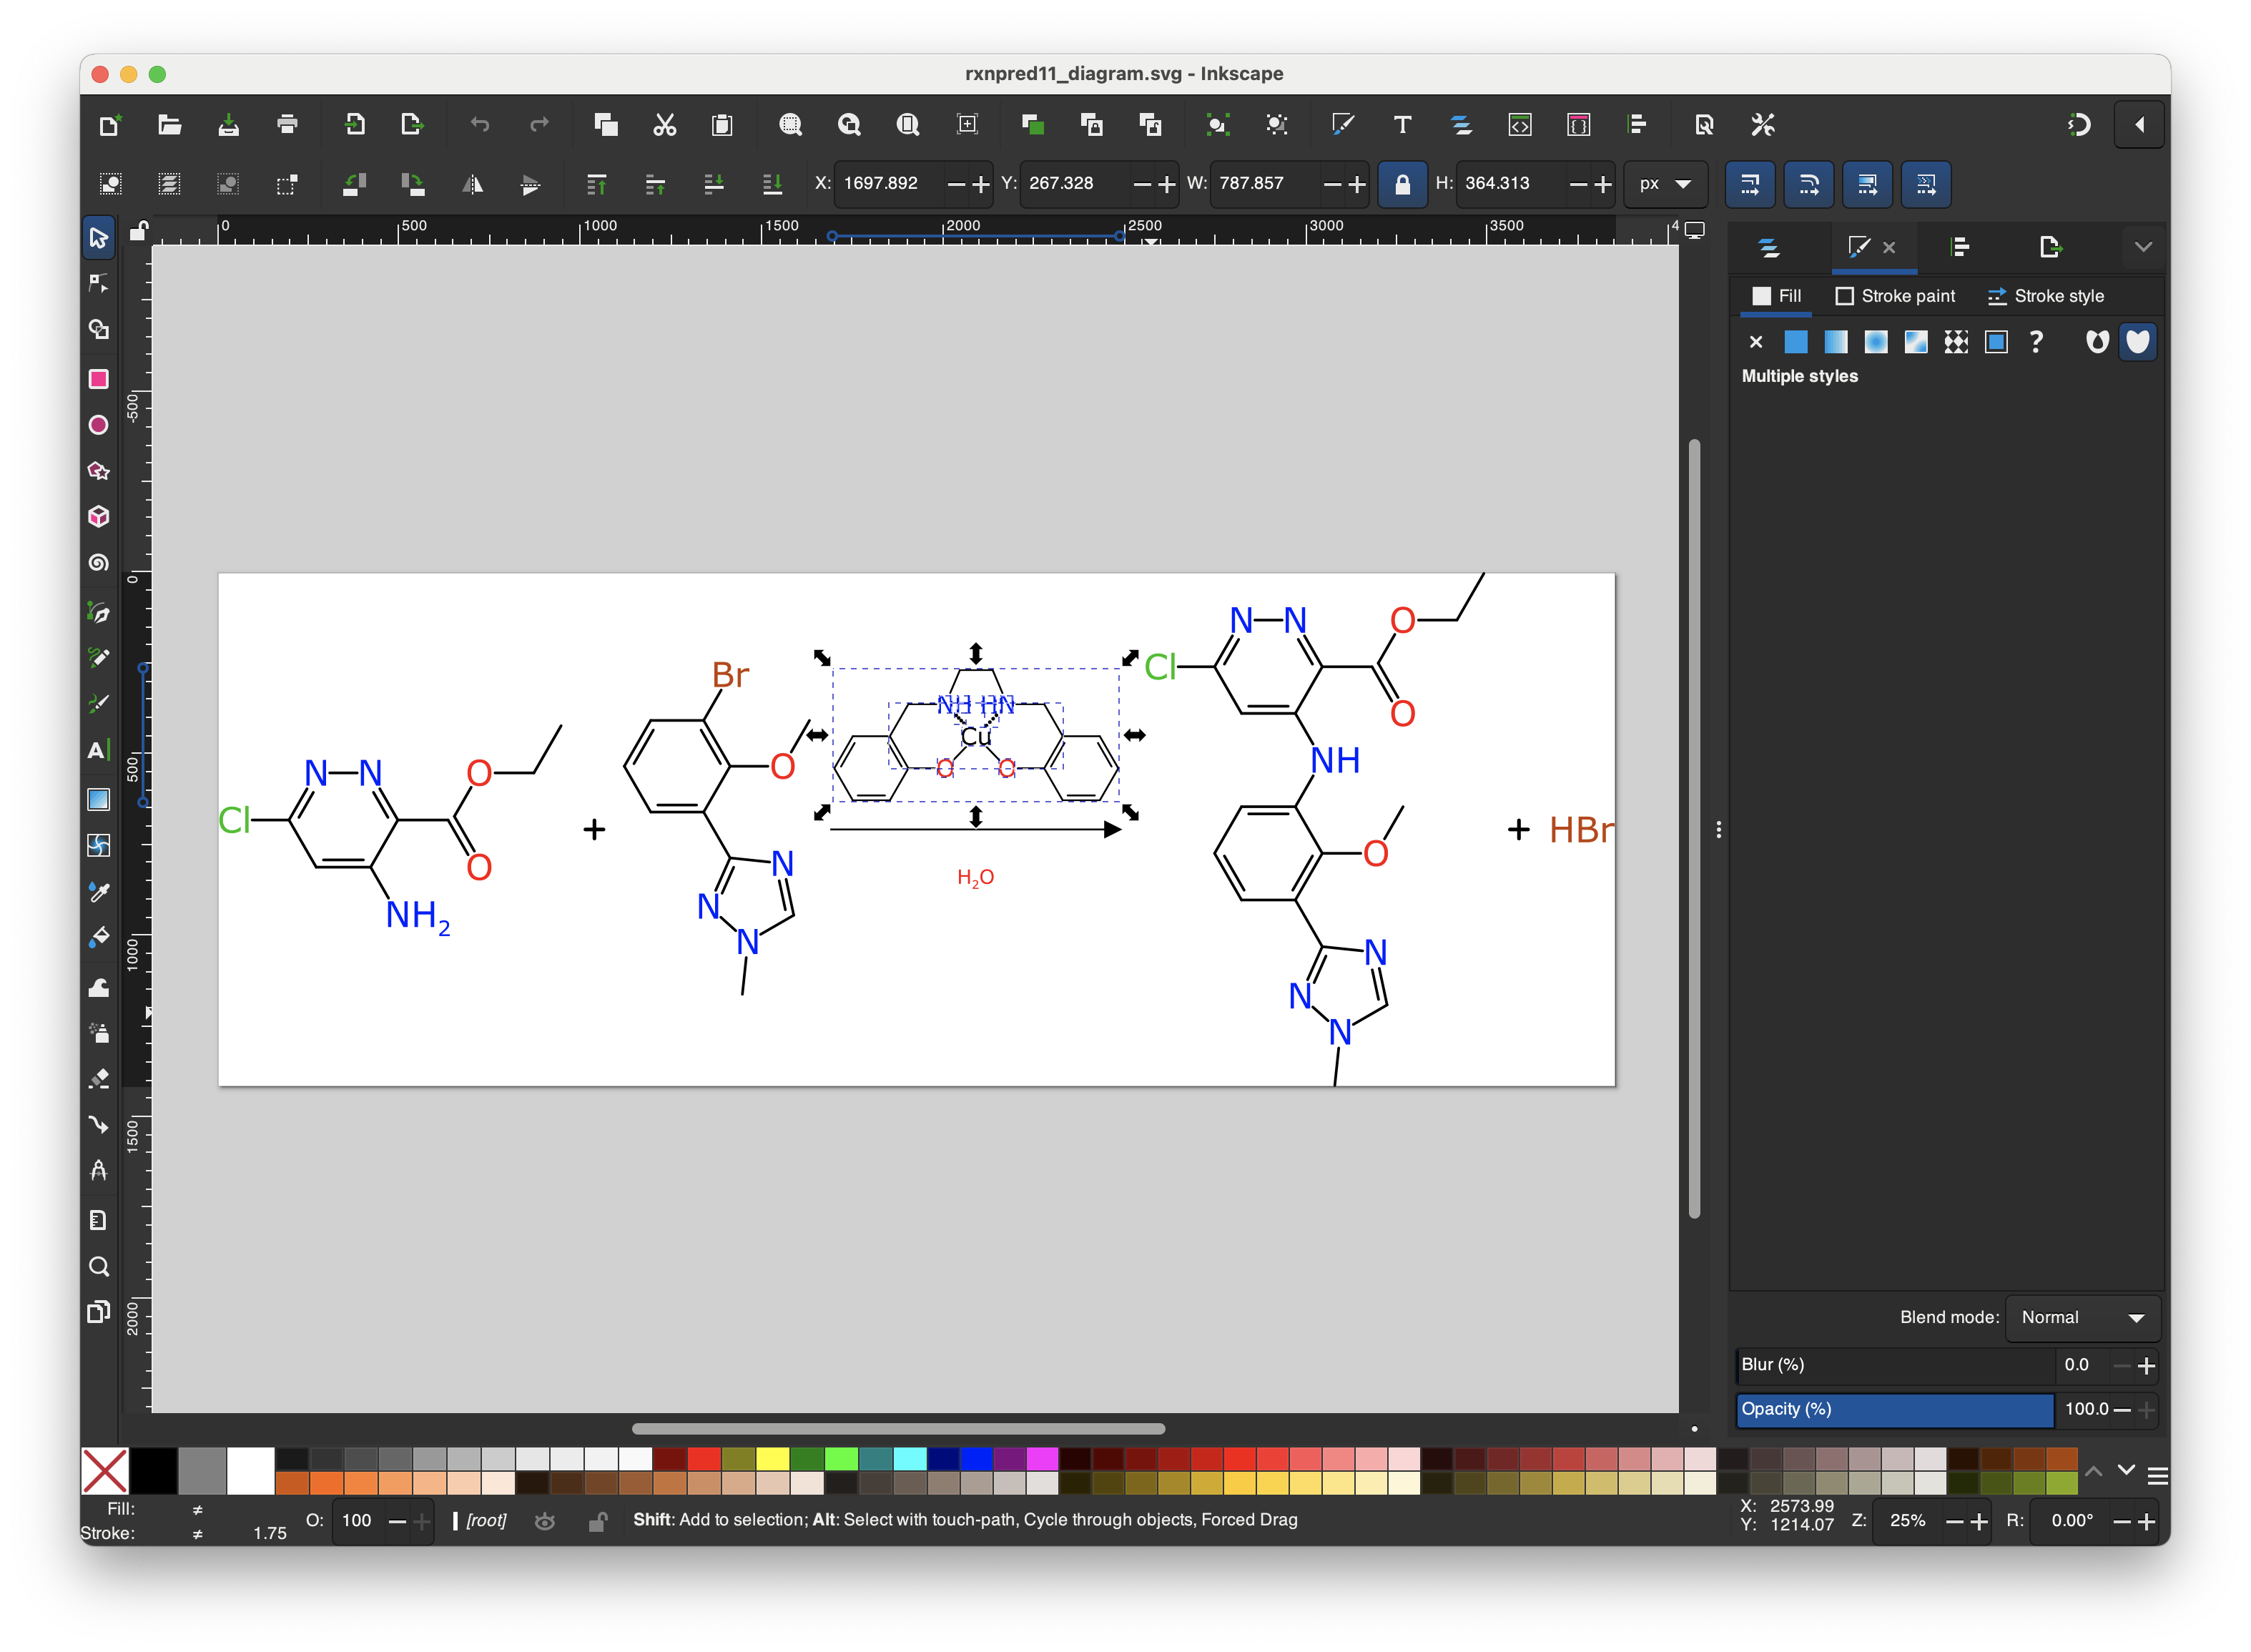
If you want to add some extra content like text annotations or a fancy background, or move a few things around to get them just right, this is a viable option (just as long as you only have to do it every once in awhile).
I would be remiss if I didn’t call attention to the detailing on the individual glyphs in the generated output:
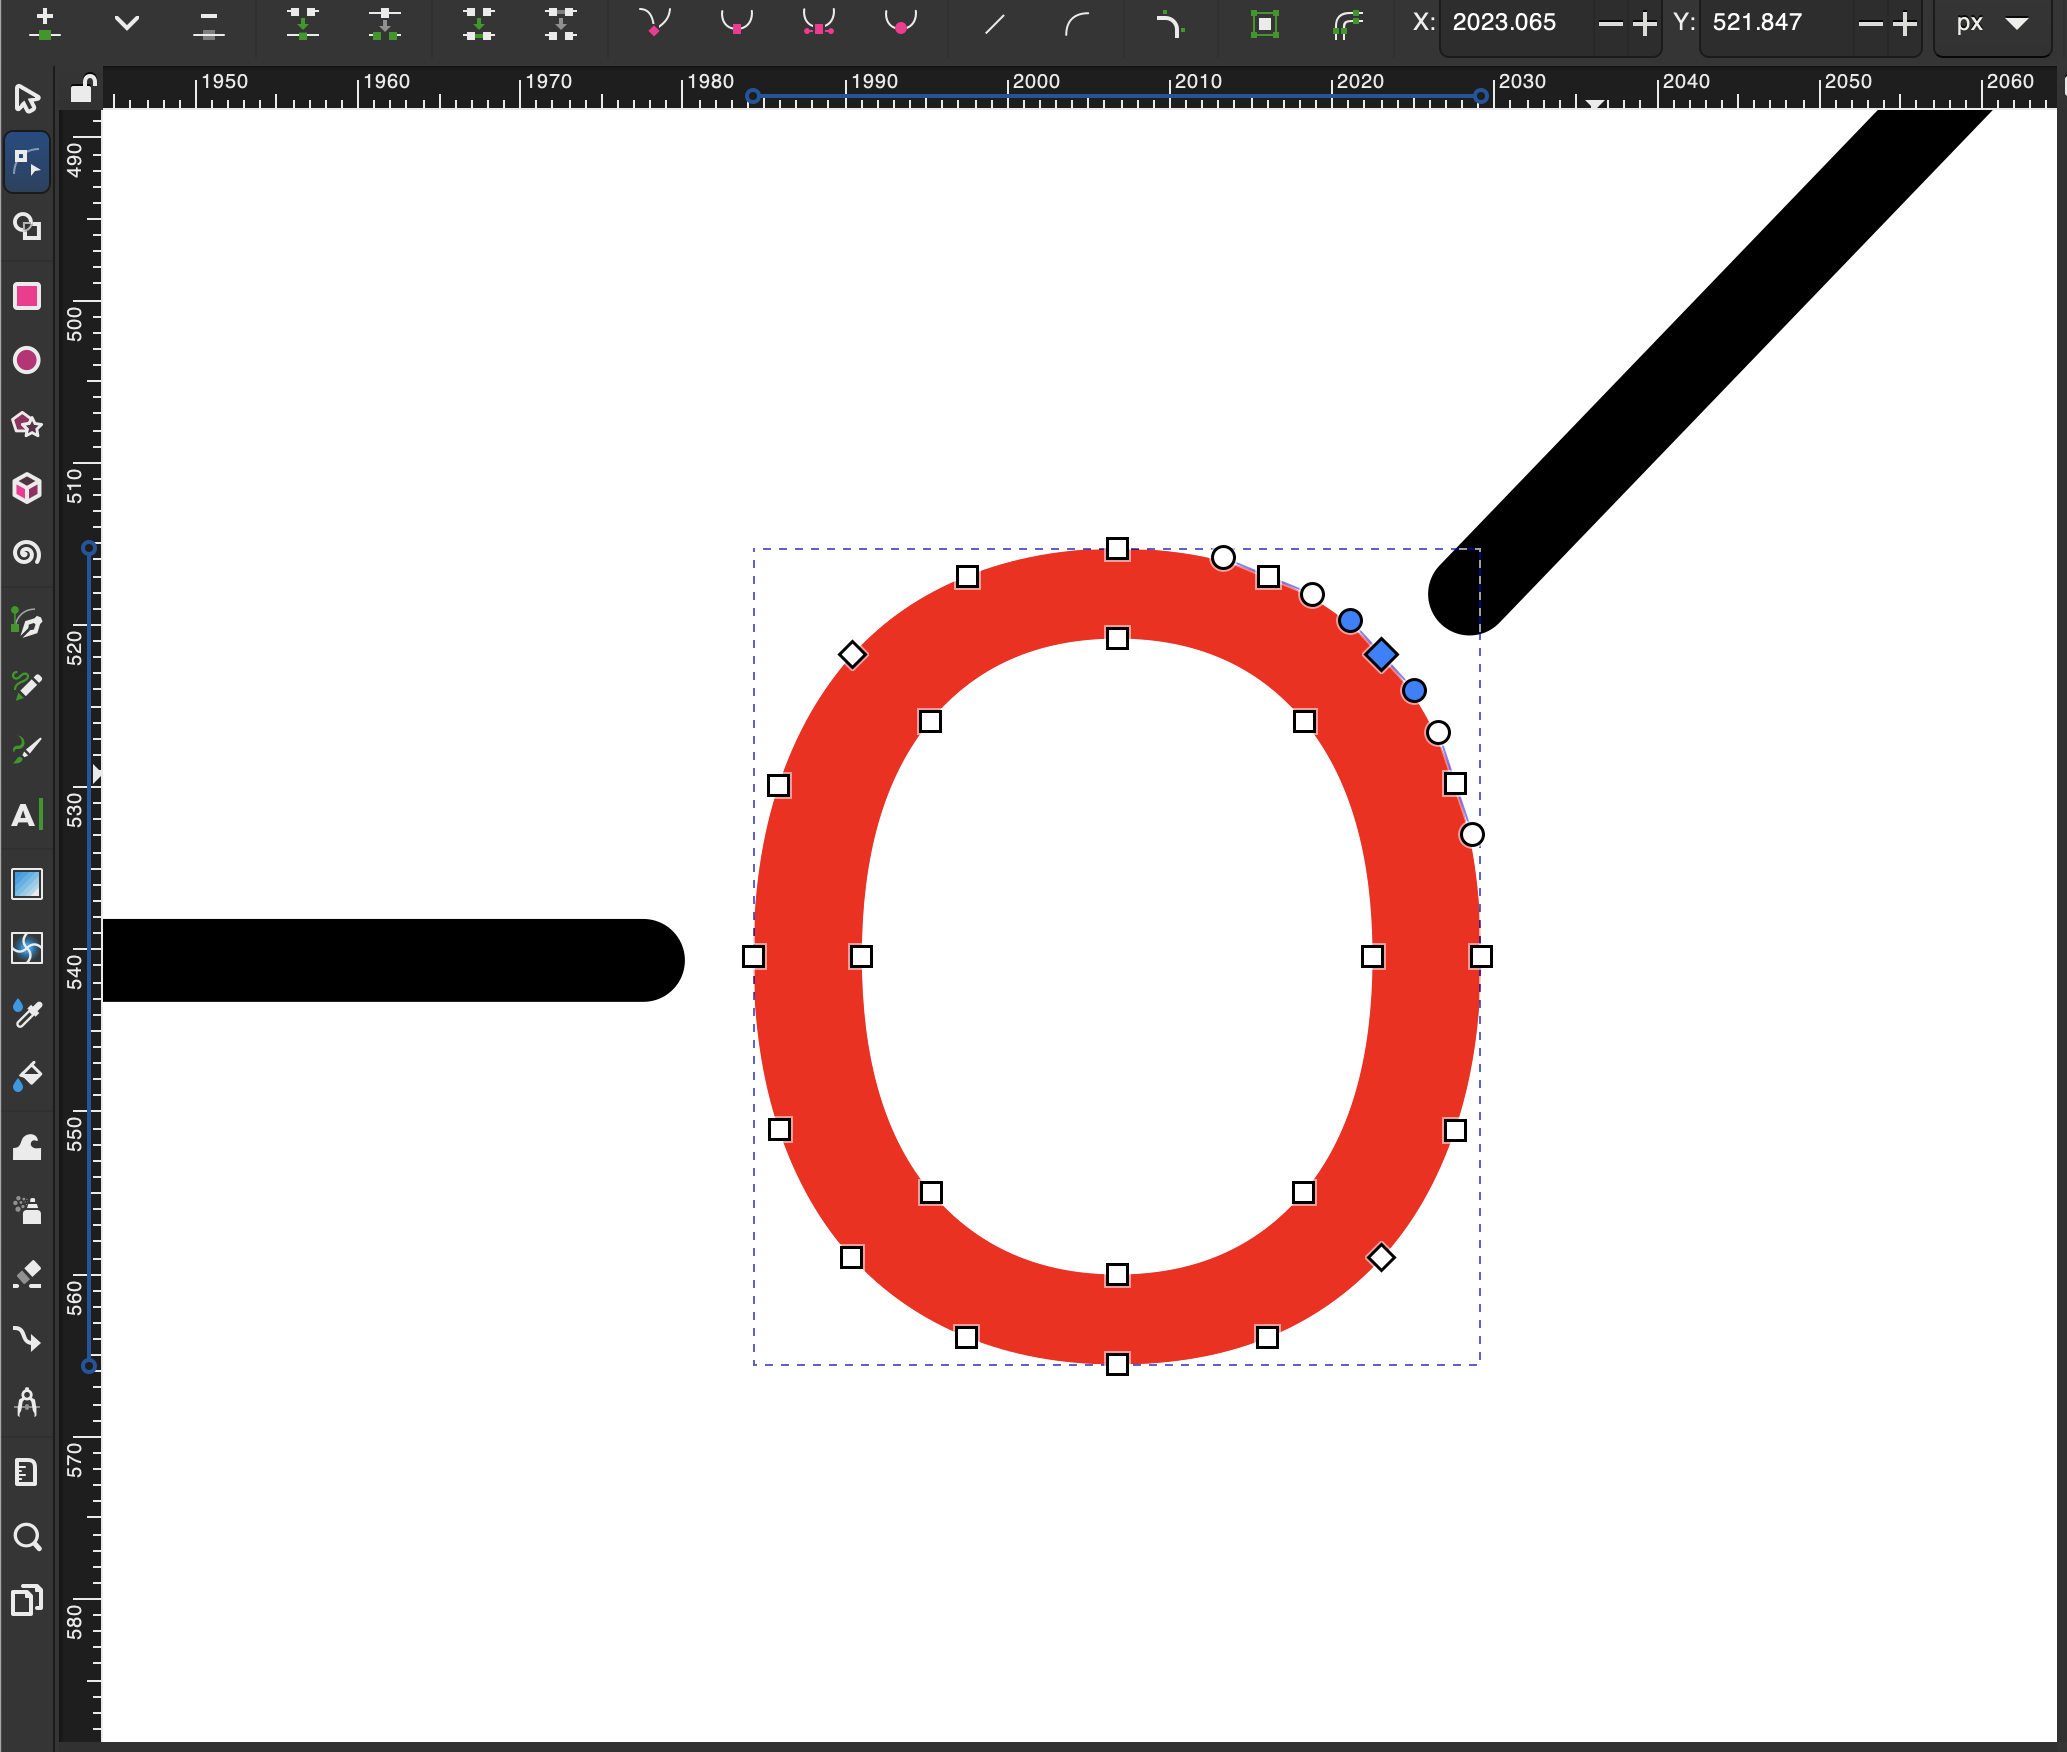
In this very zoomed-in oxygen atom with two outgoing substituents, you can see the selected spline object and its control points, highlighted by the Inkscape editor. Note the identical approach distance of the two bonds. This is the case because the molecule presentation algorithm uses the definition of the glyphs for each alphabetical letter to determine the approach cutoffs, in its quest for calligraphic perfection.
The next article is about following up synthetic planning.
