 The Green Lab Notebook (GLN) app, mentioned in the previous blog post, makes a strong point of capturing the cheminformatic data of each chemical reaction at the point of entry, i.e. the scientist who currently knows more about that reaction than anyone else in the universe needs to provide that information in a digitally hygienic and lossless form.
In my recent presentation to the German Chemical Society, I included an abridged mini-rant about the importance of capturing the reaction data in a marked up format that considers the ability of an algorithm to correctly analyse the data as the highest priority, against which there is zero tolerance for compromise; other considerations are important, but less so. Such other considerations include familiarity and convenience of the chemists who end up using the software. These are nice-to-haves. Granted they are really nice to have, but if it’s a choice between corrupting the core data and introducing systematic long term errors (of the propagating variety) into the body of chemical information, and persuading chemists to learn to do things slightly differently so that they can have it all, then there is really only one moral choice (I would do so far as to describe dissenting opinion as scientific fraud!)
Chemical diagram drawing follows a long tradition of integrating graphical schemes which assimilate with the text of the article. In the 1980s, when chemists were learning to use desktop-based applications for drawing their chemical structures and reactions, the objective was to make nice diagrams and do it conveniently. This was an ambitious goal at the time, but the mission was accomplished conclusively, because the alternative was hand-drawing, or using physical stencils, which is a relatively straightforward value proposition: the alternatives were awful.
But somewhere along the line, we software people got our wires crossed, and we missed an incredibly important point: just because these structure diagrams are digital, it doesn’t mean that software can do anything useful with them, besides using them to draw pictures. The reality is that if you use ChemDraw (or something equivalent) to sketch out your molecules, you are quite likely not creating useful chemical information. In fact it’s quite likely to be worse than useless, because what you are often doing is creating partial information, because a collection of molecules & symbols that tie them together to describe a reaction to a scientist who is up to speed on the subject area involves using a mixture of objects that have well defined meaning, poorly defined meaning, or no meaning at all. It is often possible to salvage some content from such a collection, but it’s never possible to be certain that no important content was missing, which means that most chemical information resources cannot be interpreted without resorting to a series of guesses and dubious assumptions.
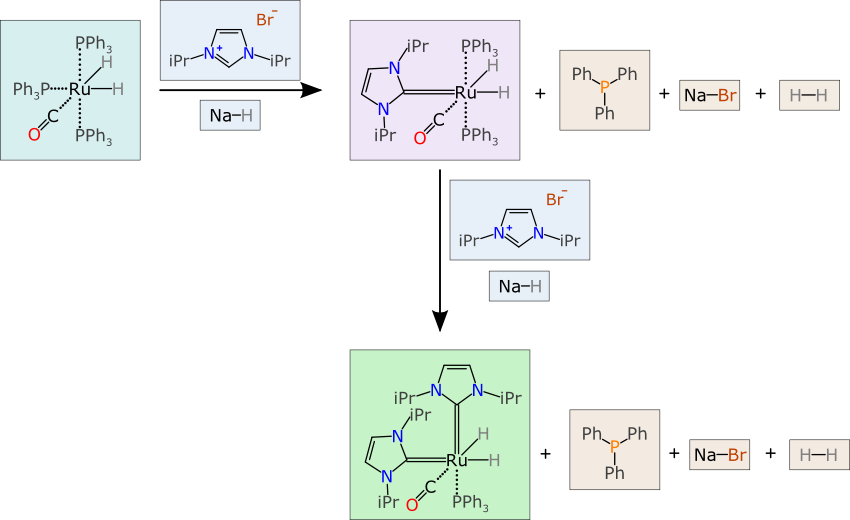
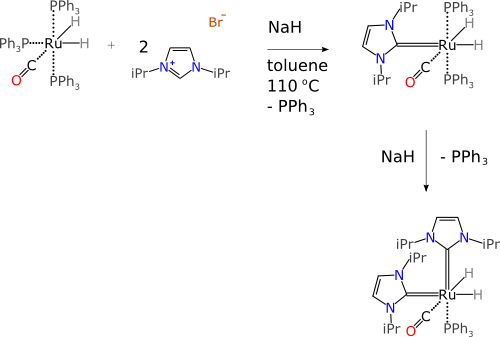
As a case study, contemplate the following reaction scheme:
First of all, let it be noted that each of the chemical structures is represented in a chemically meaningful way which is up to scratch for organometallic compounds (c.f. zero bond rant). We can skip that part, without going into some of the abominations of individual structure representation, because it is already in order, but that still leaves a long list of problems.
The above diagram is fairly representative of what you would expect to find in the scientific literature (i.e. not a straw-man example). So imagine now that you happen to be an computer algorithm, and you are presented with the above diagram, where the data structure is given as a collection of atoms, bonds, text and graphical objects.
The first part of understanding a chemical reaction is to divide the scheme into components. For a freeform jumble of atoms & bonds, it is often possible to do this by having special symbols (“plus” and “arrow”) to delineate components, and this is usually very easy for a human brain to do, but it’s a lot harder than it looks for software. This diagram has two steps to it, and only one of them is drawn left-to-right; the direction then changes to downward, which requires extra logic, and protection against boundary cases. Furthermore, one of the reactants is a salt, which has two connected components: the software needs to reconcile the first block having 3 graphs with at least one atom/bond, and just one “+” symbol, and so have some kind of proximity test to figure out that the bromide ion is part of the same material substance as the imidazolium cation. Charge matching can help in this case, but when there are multiple charged species, or non-charged adducts, it is quite easy to fool the algorithm, which means that it has to resort to a guess, and guesses wrongly.
Stoichiometry is also very hard to work with in the freeform canvas mode. This diagram implies that there are two equivalents of the proto-ligand, but the “2” is encoded as plain text, and drawn close to the ligand picture. Custom logic could be used to interpret this correctly, but the pitfalls should be pretty obvious: communicating highly marked up content with freeform text whose meaning is dependent on its position on the canvas relative to other objects… well, if that seems like a good idea, you should probably stop reading now.
The free text issue continues, because chemists use a limitless repertoire of shorthand notations, which are often annotated in the proximity of the reaction arrows. For the first transform, there are four of these: “NaH”, “toluene”, “110°C” and “-PPh3“. Respectively, these imply an additional reagent (molecular formula/shorthand), the reaction solvent, the reaction conditions (temperature) and an unwanted byproduct species. All of this information is impenetrable to an algorithm. Even though some of it could be guessed by text mining, the rate of misinterpretation by outright mistakes and ambiguities, combined with the absence of other correlating information, makes this a bad idea: an interpreter is actually better off ignoring it (better to have 50% of the data with a 10% error rate than to add another 30%, half of which is wrong).
Even a serious attempt to interpret the freeform data to obtain a balanced reaction with correct stoichiometry, assuming that the guesses are correct, is stymied by the simple fact that part of the shorthand of chemists involves not bothering to mention details that are obvious to other chemists. While in this reaction example the triphenylphosphine byproduct is mentioned (in shorthand notation), the other byproducts are not: sodium bromide and hydrogen gas are created in one equivalent at both steps. And also the shortcut of representing both equivalents of the proto-ligand at the beginning of the reaction means that the two-step nature of the reaction is inherently unbalanced.
For a lab notebook to capture a faithful representation of the reaction transformation that is happening here, we need a datastructure that has appropriate fields and markup that provides a way to specify the components in a way that is unambiguous. So consider this much more highly organised version:
Each of the components has its own box, which contains a valid chemical structure representation. Each of the components has a type and a place (e.g. reactant, reagent, product, byproduct, intermediate). The components can each be marked up with any number of additional properties, such as name, stoichiometry, quantity, reference data, etc. Information such as reaction conditions can be stored as well, but clearly separated from the structural definition of the chemical transform.
The datastructure that describes this information is not a one-to-one mapping of the way chemists draw pictures for writing articles. Rather, it is designed to store and deliver the meaning of a chemical reaction, in such a way that software can easily interpret it, correctly, with no need to guess, and no introduction of errors by mistakes or omission.
There are multiple ways to implement a user interface with this level of markup: one approach is using a freeform canvas (which people are used to), and add a real time interpretation layer, so the user can see what the algorithm thinks the user is trying to say (e.g. move the bromide anion to another part part of the screen and observe that the software now thinks that it’s the counterion of a different molecule), and if the meaning is taken incorrectly, then the user needs to intervene in some way. For desktop software this is quite a promising approach, since it provides a graceful migration pathway, but my interests these days are building software for mobile devices, which have screens that are really a bit too small for drawing even one molecule at a time. The size of an iPad is just big enough to fit a trivial single step reaction on conveniently, but add a second step or a non-tiny molecule and editing everything at once gets very awkward. And for an iPhone, forget it. Much better to draw each of the chemical structures individually, which has the added bonus of being a much more natural fit for the component-wise datastructure that is necessary to capture chemical reactions.
Bringing all of this back to the subject of the post: the Green Lab Notebook is following in the footsteps of previous apps when it comes to representing reactions in a non-broken way. Starting with the Mobile Molecular DataSheet‘s ability to work with reaction datasheets, and followed by Reaction101, then the Yield101 prototype lab notebook: these ideas about component-wise reaction representation form the basis of products that are already highly functional. All of these apps have highly usable graphical interfaces for creating this data, and algorithms that can produce publication quality diagrams from it. The Yield101 app introduces additional reaction markup in the form of quantities: mass, volume, moles, density, concentration, and yield; it can use the structure + stoichiometry of the core datastructure to automatically calculate quantity information.
The yield datastructure is layered on top of the reaction datastructure, and in turn the Green Lab Notebook further extends this by defining an experiment, as having the properties used by these earlier products, but taking it further. The first important extension is handling of multistep reactions. The specification is still in progress, but early screenshots of how this plays into the product should be forthcoming soon!
