As alluded to in the previous post, one of the priorities for the Green Lab Notebook app is to make sure that it is possible to take your painstakingly drawn and cheminformatically correct reaction schemes, and produce a manuscript-quality diagram on export. This is starting to bear fruit, as the experiment-to-vector layout algorithm has been ported to the serverside (com.mmi) framework, and can now be used as the engine for creating inline graphics for tables in a Microsoft Word document:
|
|
|
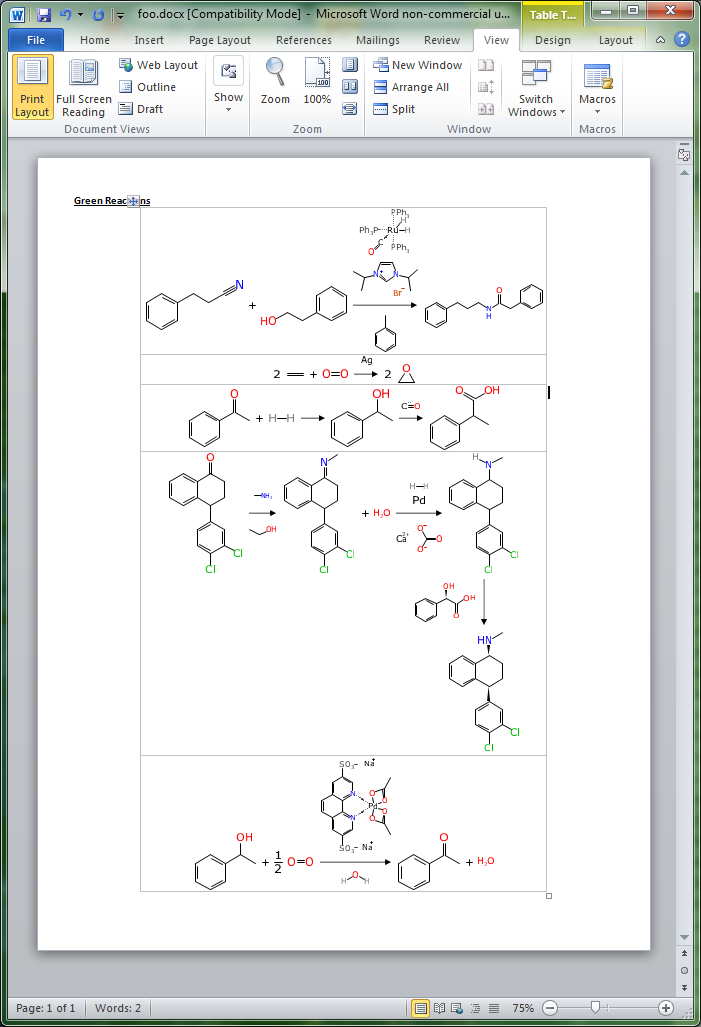
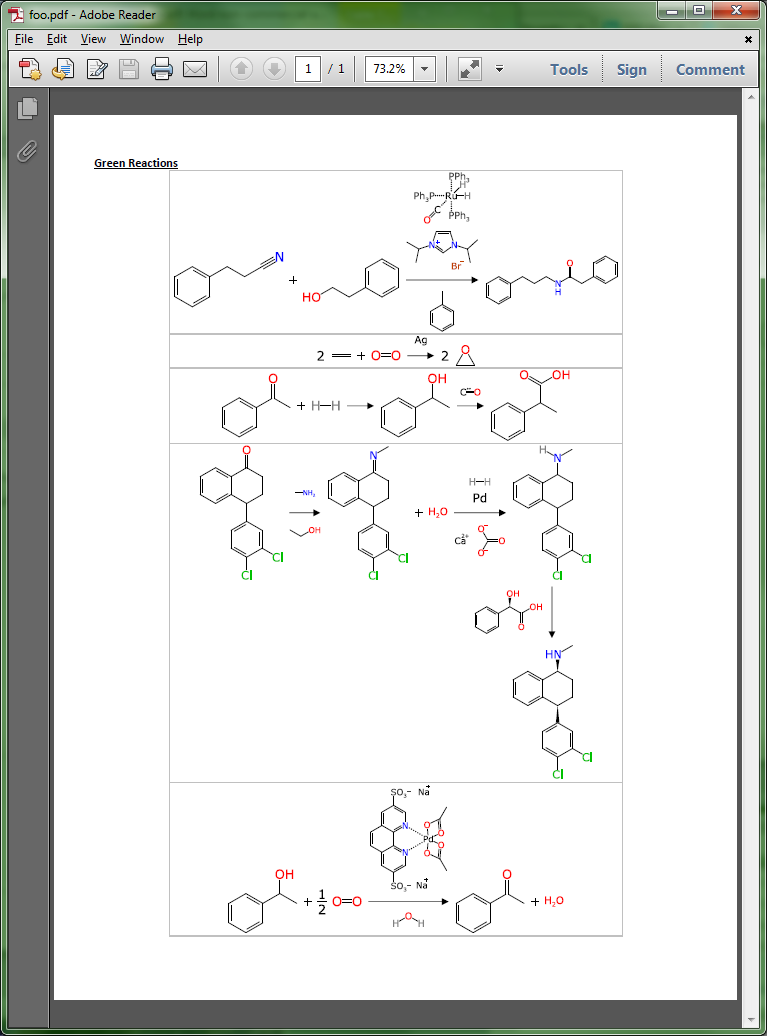
The above diagrams show a screen capture of Microsoft Word on the left, editing a document that was created procedurally by converting the datasheet of green reactions (a default experiment collection in the Green Lab Notebook app) into a DocX file, with embedded vector graphics (using the OOXML graphical markup language dialect). On the right is what happens when you use Word 2010 to export this to a PDF file (see the actual PDF here).
This vector graphics capability will be made available from within the app soon, but it’s just the starting point: currently just the actual reaction scheme is rendered. The intention is to also include all of the rest of the information about the reaction, such as the breakdown of individual components, their quantities and miscellaneous other properties, and calculated green metrics.
