 My most recent publication is now available as early access, and is entitled Rendering Molecular Sketches for Publication Quality Output (Molecular Informatics, 2013). As the title suggests, the paper describes the process of turning a data representation of a molecular structure into a graphical figure that is suitable for the most aesthetically demanding circumstances (e.g. manuscripts, posters, etc.). If one were to start with a connection-table representation of a molecule, with well selected coordinates (e.g. a typical MDL Molfile, among others), the process of creating a perfect diagram seems pretty simple compared to everything that goes on up to that point, but actually it’s not. There is a great deal of information that has to be inferred before a great picture can be produced. The paper goes into a lot of detail, and describes all of the important algorithms necessary to bridge the gap.
There have been quite a few papers published about depicting chemical structures, with regard to selecting Angstrom-like positions for all of the atoms (including one of mine), and that is certainly the hardest part, but there does not seem to be any prior art in the literature for the final step.
Incidently, I actually wrote this paper quite awhile ago, and originally submitted it to the Journal of Chemical Information and Modeling, but in the editor’s infinite wisdom, it was deemed to be not within the journal’s domain, and rejected without review. Unsurprisingly I was not particularly impressed by this decision, and sat on the paper for a year or so. In a way the manuscript is quite charitable, since it reveals an important competitive advantage of my company (see below) and makes it much easier for anyone else to catch up, so the pros and cons of publication vs. secrecy both have cases to be made. In the interim, I toyed with the idea of publishing in an open access journal, since I do feel quite strongly about this subject, but simply couldn’t swallow the bitter pill of the author pays hack, which makes the whole subject into a twisted joke. I had high hopes for PeerJ, but when they launched, I discovered that their topic lists are strictly biology-only, so chemistry will have to wait a little longer for a viable solution. In the meanwhile, though, I have had some positive experiences with Molecular Informatics, having published two papers there last year (a, b). It seems to me that this journal is now one of the best places to publish cheminformatics method papers.
The method that is being described is based on a specific implementation of the rendering process, which takes an structure (e.g. a SketchEl molecule), with some rendering options, and proceeds to construct the output in the requested format. These formats include bitmap images (PNG, JPG, etc.), vector graphics (SVG, PostScript), scalable web objects, and documents with embedded vector graphics (Microsoft Word, Excel). The software stack itself is implemented in Java, and while it is not (yet) possible to obtain any products which have this technology baked into them, it is available under a number of circumstances, because it is part of the web service engine that runs molsync.com.
When you use the Mobile Molecular DataSheet app to send a molecule via email, the app always includes the underlying data and a picture generated by the app itself, but it also offers a number of additional optional attachment formats:

All of these are created by deferring to the molsync.com webservice. Any of the graphics formats created in this way make use of the algorithms described in the paper, rather than the simpler (though still quite good) rendering algorithm used by the app itself. A similar choice is provided when reactions or datasheets are being exported. For collections, it is also possible to have the webservice create Word/Excel files that contain multiple embedded vector diagrams of structures or reactions; or, create a ZIP file that contains a graphics file for each structure or reaction. All of this machinery also makes use of the top of the line publication quality rendering algorithms.
The smaller, simpler MolPrime+ app also draws heavily from the webservice, for example when exporting a Word document with an embedded structure:

The MolSync app also offers a variety of graphics conversion options, which adds an extra level of convenience for certain workflows, because the app works directly off your Dropbox or iCloud filesystem, and will write the resulting graphics files to the same place, which makes it very easy to incorporate them into manuscripts or presentations:

A number of apps offer web-sharing or tweeting capabilities build into them (e.g. MMDS, SAR Table, MolSync, MolPrime, Reaction101 and Yield101). This involves a two step process, which starts by uploading the molecule, reaction or datasheet to the molsync.com service, which generates an identifier URL, and then doing something with it: either handing it off to the browser, allowing it to be viewed or shared as necessary, or directly hooking into your Twitter account from the app itself, making it available to the world.
You can see how it works by clicking on: http://molsync.com/share/?mol=1:
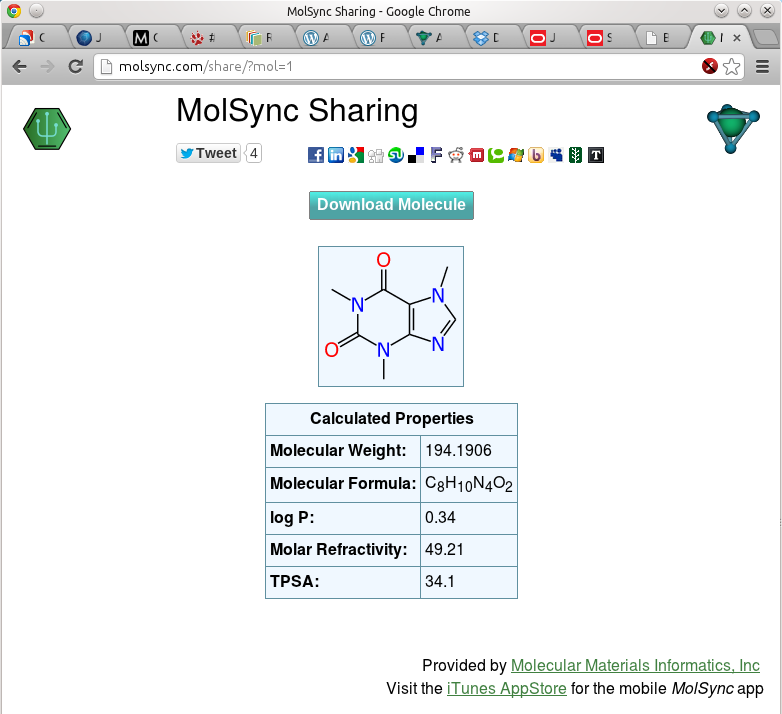
On the face of it, this service doesn’t seem particularly special: a picture of a molecule, some calculated properties, and social media sharing links. You might notice something slightly uncanny if you use a desktop browser and hit Ctrl-+ a few times: the picture of the molecule increases in size and remains crystal clear and sharp, as does the text… whereas all of the other images on the page get more pixelated and blurry. This is because the molecule picture is actually rendered as a vector object, performed by combining heavy duty publication quality techniques on the server with modern browser features on the client.
It gets more interesting when you hit the Download button:
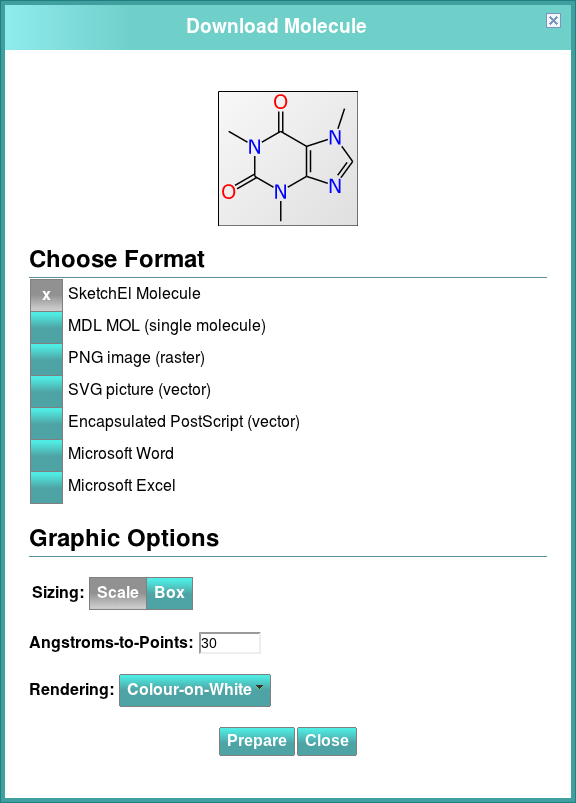
The dialog that pops up is able to offer a variety of format conversion features, because the page isn’t just a stashed bitmap, but rather it’s a live data representation of the molecule. It is rendered dynamically, and can be re-rendered to other cheminformatics formats, as well as other graphics formats. It is also possible to request sizes and colour schemes, to suit the purpose at hand (e.g. colour-coded atoms are often preferred for PowerPoint slides, while black-and-white is the norm for must printed documents). And all of this is available for free to anyone who wants to use it, the only catch being that the data is stored on the open web.
Publication of web structures is not restricted to mobile apps, either. There is already an Accelrys Draw plugin (written by James Jack) that can upload & tweet structures that are hosted by the molsync.com service, and hence benefit from all of the rendering options.
