 The last two posts introduced molecules and collections being embedded into a WordPress document. Now the range of datatypes has been extended to include reactions, which can be rendered as schemes – or tabular forms indicating all of the components that go into a multistep reaction, with associated stoichiometry and quantity information.
In the context of using blogging software like WordPress for an electronic lab notebook for chemistry, reactions need to be first class citizens in terms of datastructures, since such a large portion of chemical research is centred around turning something into something else. As per usual in this niche, there are plenty of options when it comes to using a piece of software to render your reaction scheme in the form of a diagram and save that diagram in a form that can be displayed on the web. When it comes to software that can store the components in a meaningfully machine readable way, and still allow the content to be rendered in the way that appeals to human scientists, those options shrivel up and drop off.
The plugin currently supports just one data format – the Aspect protocol for Experiments, which can be edited using a couple of tools, such as the Green Lab Notebook app, or more recently, XMDS (for the Mac), e.g.
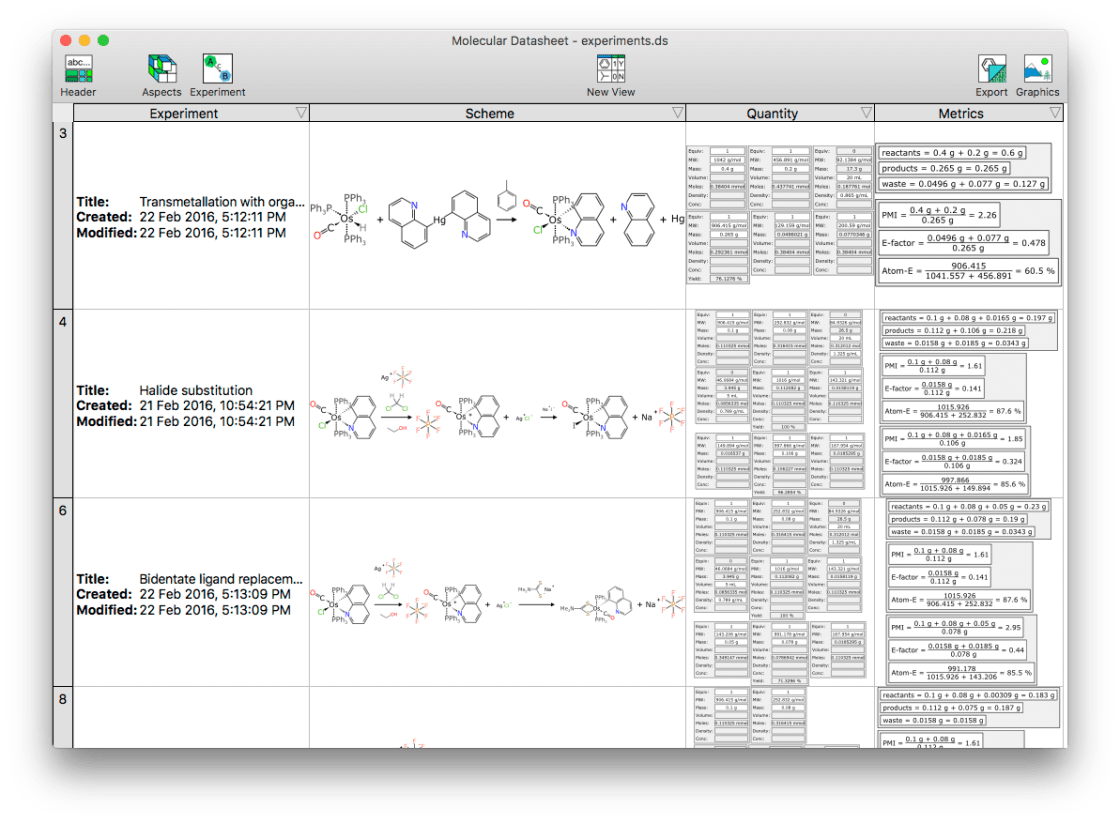
Having sketched out the reaction scheme with all of its steps and reagents, and any other relevant properties (e.g. stoichiometry, atom mapping and quantities), the easiest way to get it into WordPress is to upload it, and then reference the file.
An example of editing a blog post is thus:
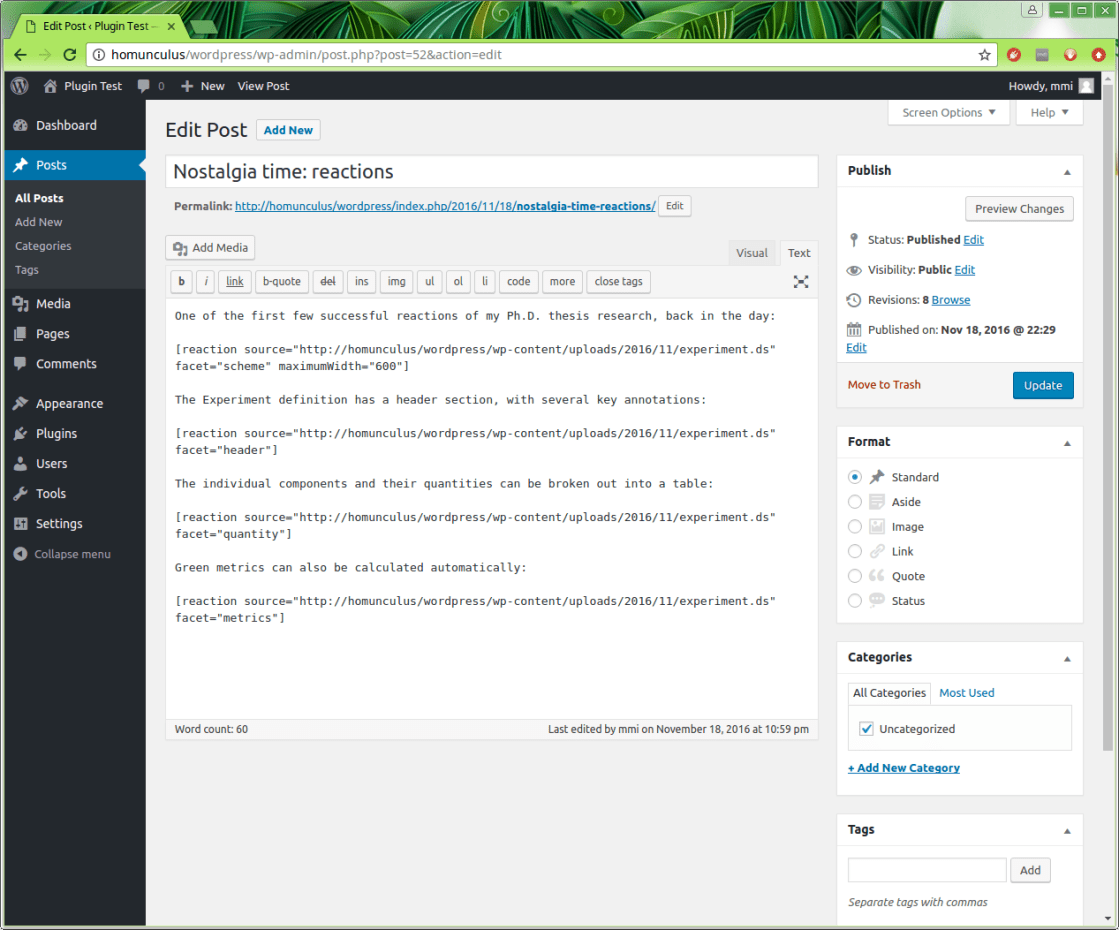
The first invocation is written using the [reaction] shortcode:
[reaction source=”http://homunculus/wordpress/wp-content/uploads/2016/11/experiment.ds” facet=”scheme” maximumwidth=”600″]
In the snapshot above, the reaction code is embedded a total of 4 times, once for each facet. The default facet – scheme – renders the reaction scheme, in its traditional diagram form, as can be seen when viewing the outcome of the post:
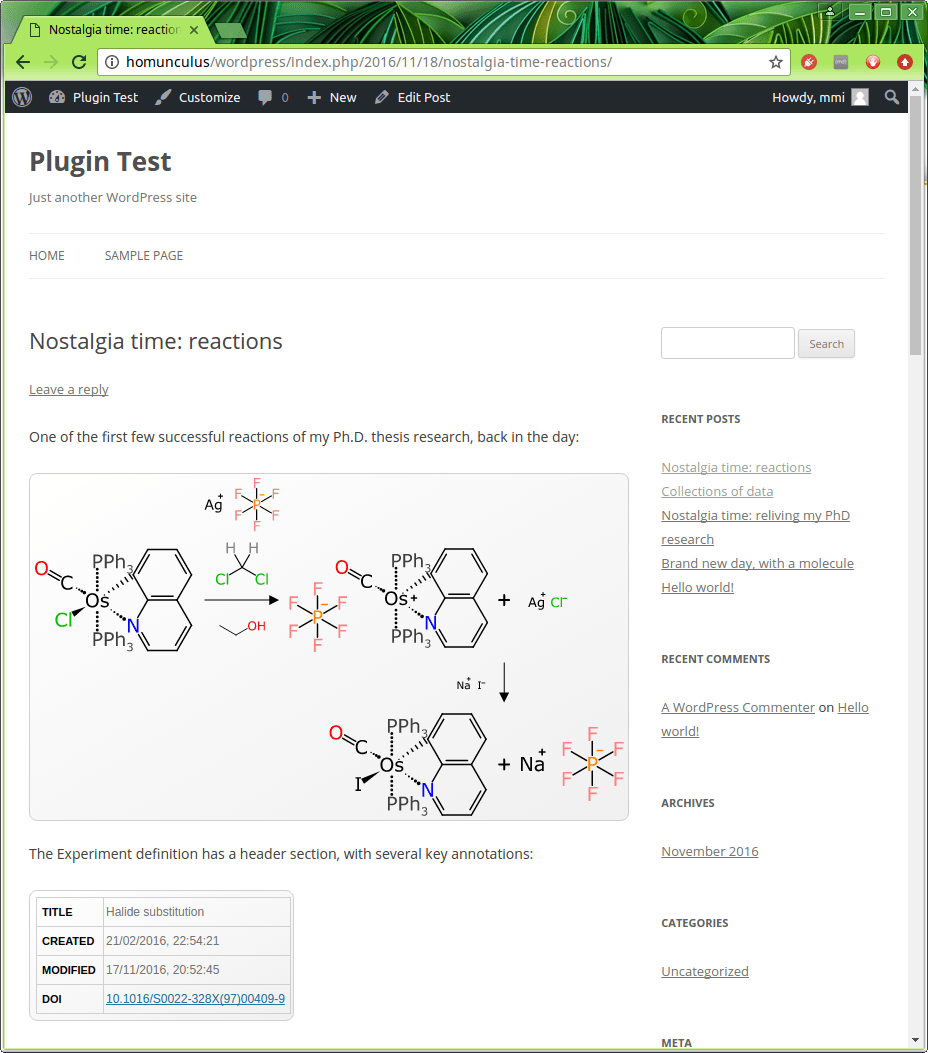
The main diagram in the picture above is a rectangle that shows one of the reactions that I remember fondly from the opening months of my graduate school research. This one is a two step reaction, and note that the directionality is “bent” in order to fit it into a comfortable screen width. All of the reactants, products, intermediates, reagents, solvents and known waste products are represented as individual components, which is all important stuff.
Keep in mind that the actual datastructure for this reaction is basically a list of structures + metadata about what role they play: the reaction layout and various annotations are assembled by an algorithm, and this is all done in the native web runtime (i.e. JavaScript).
Right under the scheme in the snapshot above is the header facet, which displays basic information that is stored for the experiment entity overall, which includes a title for the reaction, and first/last modification date. There is also a field for DOI (digital object identifier), although despite the name, it can be overloaded with other kinds of identifiers. The rendering will try to turn this into a clickable link if possible. While you can’t get that effect by clicking on the screenshot, this is what happens:
10.1016/S0022-328X(97)00409-9 (spoiler: it goes to the literature)
In order to see how much of what went in and out, the quantity facet is used:
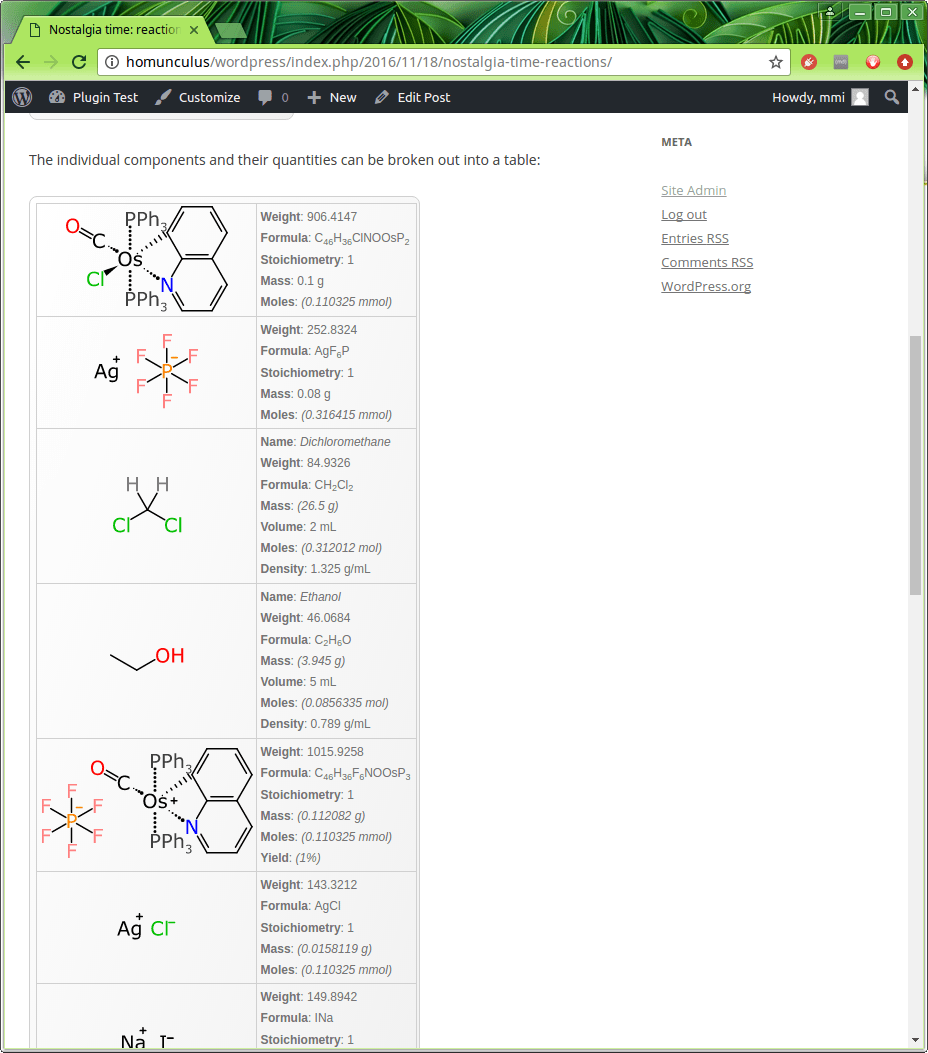
This is a component-by-component breakout of everything from each of the steps. Any quantities that were entered explicitly are shown in regular font, e.g. the primary osmium-based starting material used 0.1 g, and it was mixed with 0.08 g of the silver reagent. Because the scheme keeps track of stoichiometry, and which reagents are stoichiometric, and the structures are represented using a datastructure that implies the correct molecular formula (despite the weird organometallic bonds and gratuitous use of abbreviations), it means that a whole lot of theoretical amounts can be calculated based on molarity – up to and including the final yield (though if you look closely you will see that there is a bug in one of the examples: that’ll get fixed shortly).
The last couple of entries, including the final product, are shown below:
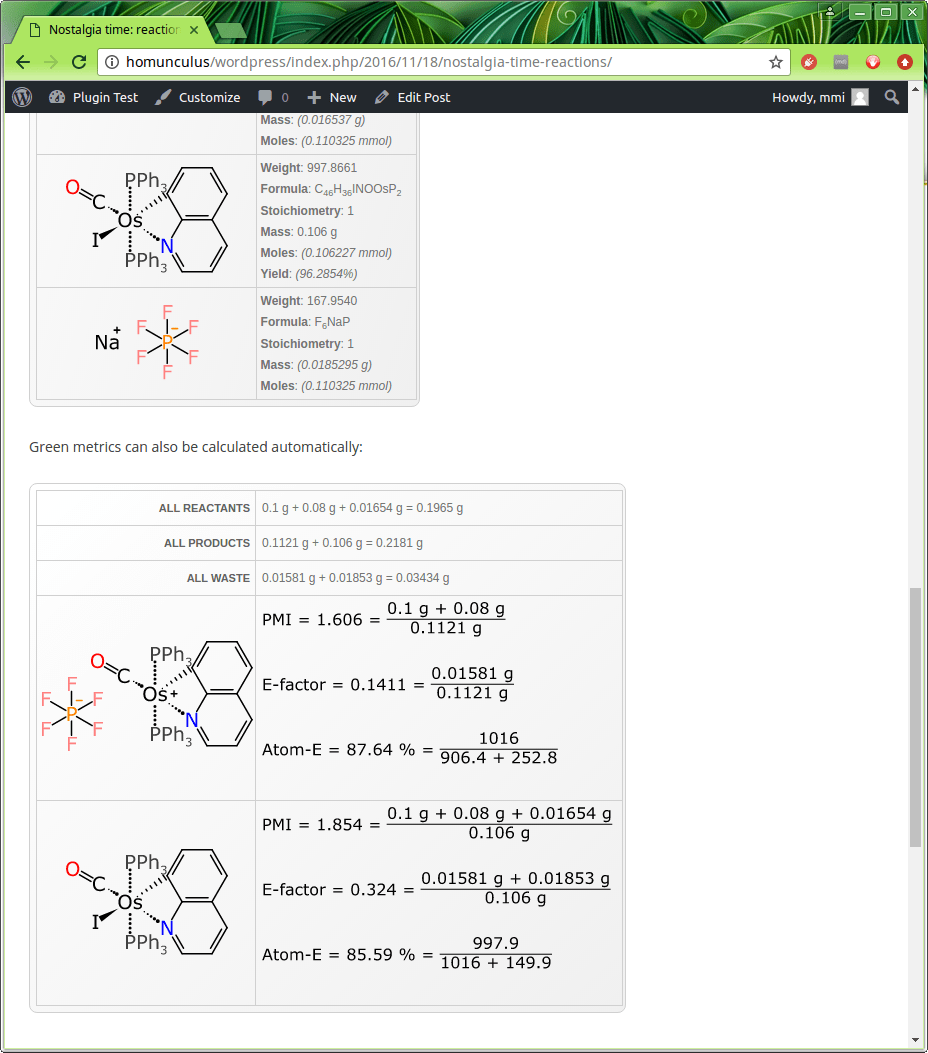
Underneath the quantities is the metrics facet, which uses this same quantity information to provide summary stats, and compute three important green chemistry metrics: namely the PMI (process mass intensity), E-factor, and atom economy. These metrics have the odd property of being completely trivial to calculate, just as long as you have the actual information to feed into them: and this is of course the hard part. Using a complete datastructure, as this system does, makes it possible to have these automatically determined.
The proof of concept plugin now has the 3 main datatypes covered (molecules, reactions and collections). The next thing to look into for this project is making it a bit easier to insert content into the blog post. This will of course be covered by another blog post.
As mentioned previously, the codebase for this functionality is WebMolKit, which is technically already open source (GPL v3), but the GitHub project is still private. The toolkit is still mutating a bit too quickly to seriously encourage anyone to try using it, but if you are really interested in trying it out, I can share it on a case by case basis. If all goes well it will settle down soon, and it’ll be made available to anyone – along with the “MolPress” plugin.
