 Structure-activity datasets for small molecules targeting the global COVID-19 pandemic are starting to emerge. Some preliminary modelling and interactive tools based on one of these datasets is available at https://molmatinf.com/covid19.
Like almost every other human on the planet (how often do we get to use that phrase non-ironically?), I have been self-isolating and nervously keeping an eye on the statistics, as the global infection rate shows no sign of slowing down anytime soon.
Recently we have started to see some of the fruits of hard-won experimental data make its way onto the internet. The most promising dataset that I have seen to date is from Diamond Light in the UK: according to their description, they tested about a thousand unique molecules by crystallising them with the Mpro protein from COVID-19. I’m not exactly up to speed on the biological significance of the protein, but word on the street is that it seems to be a legitimate target worth knocking out. I’m also not sure how the researchers at Diamond Light managed to get so much crystallographic data so quickly, but what they have provided us with is 91 datapoints for unique structures that were observed to stick to the active site, and 912 unique structures that did not. This is the input form that we want to see for a binary structure-activity model, e.g. using Bayesian techniques.
The structures are all very small, and are classed as fragments, i.e. a real drug would probably be built up of more than one of these functional moieties, with a bunch of linker groups and maybe a few pendant chains to give it the right ADME/Tox properties. This means that a model built from these fragments and applied to drug-like or lead-like compounds would be an apples-to-oranges comparison, but if one is inclined to be optimistic, it might be useful as a preliminary ranking operation. Scoring a large batch of drug candidates against a fragment-based model would tend to give higher scores to molecules that contain chunks of functionality that overlap with molecules that bind, and so they could be moved up to the head of the queue.
Step one for making this into a model involves downloading the Excel file that has been generously provided. The file contains an indicator of which fragments are active, and it has both SMILES strings and catalog identifiers for the structures. Preprocessing of the file involves basic cheminformatics skills: converting the file into a tab-separated text file, followed by conversion of SMILES to 2D CTAB structures. For this part I used a simple Python script that calls out to RDKit, which has robust and well tested SMILES-handling algorithms. The collection has a number of duplicates, so these need to be collapsed prior to doing anything important.
There are two places you can go to obtain a processed cheminformatics-ready version:
- Jump to molmatinf.com/covid19 and download the data directly and/or try out the tools that are implemented on the page.
- If you are (or want to be) a user of CDD Vault, the data has been uploaded into CDD Public:

The special dedicated page molmatinf.com/covid19 is the subject of the rest of this article. It contains the above dataset, a model built from it, and some other goodies – available either for downloading, or to access interatively. It makes use of a number of web cheminformatics tools based on WebMolKit, for which the core functionality is open source. The page has been thrown together with a certain degree of haste, so may not be quite as smooth and polished as production software – but you should expect it to be updated a few times before the crisis is over.
After the cheminformaticisation of the fragment binding dataset, the next step is to create a Bayesian model from the 91 actives + 912 inactives. For this I used proprietary tools from Molecular Materials Informatics, but analogs are available in the open source Chemical Development Kit as well as WebMolKit. For most Bayesian models I tend to use ECFP6 fingerprints, which is a popular style of circular (or “Morgan”) fingerprints that enumerates all atom collections with a graph diameter of 6. Because these are small fragments, though, it is worth considering reducing the fragment size to ECFP4. The model generation gave an ROC-curve integral of 0.8009 for ECFP4, whereas for ECFP6 it was slightly worse (0.7964).
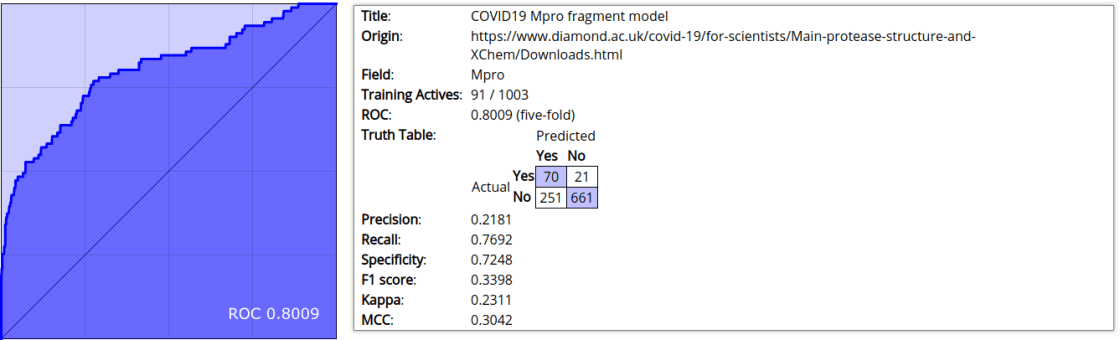
An ROC integral of 0.8 is respectable but not impressive. For one of the earliest sizeable structure-activity datasets available for the pandemic, it’s good enough to roll with, until we can replace it with something better.
If you navigate to the site (molmatinf.com/covid19 again, as before), the model stats section is followed by a readout that displays the active fragments from the screen:
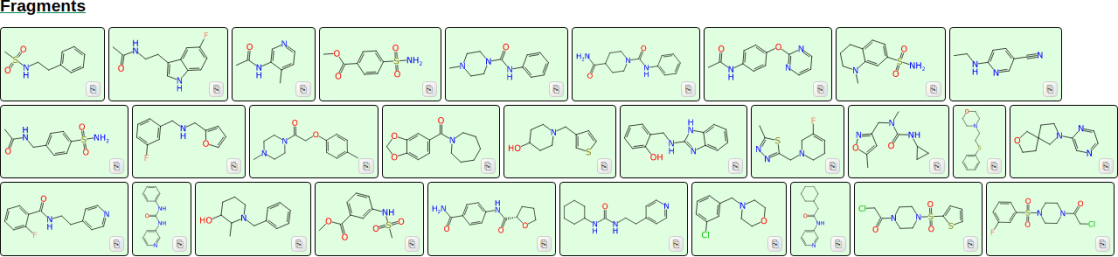
These are just for reference, but note the little button to the bottom right of each molecule, which allows the structure to be copied to the clipboard. This can be useful in the next section:

You can use the page to incorporate any number of structures into a table, and these will be evaluated according to the model. There is a button marked Example, which will feed in one of the structures that everyone is talking about at the moment – chloroquine. Adding more structures can be done by copying a Molfile/SDfile onto the clipboard and hitting Ctrl/Cmd-V, or by dragging such a file onto the page. Or you can use the Draw Molecule button to activate the built-in sketcher:

In this example I’ve started with the chloroquine structure and grafted on one of the fragments that was found to bind in the Diamond Light study (see first example in the fragments list). Upon saving, this structure is shown in the table along with its evaluated score:

The computed score is 4.450. The meaning of this particular kind of Bayesian score is uncalibrated and unitless. Higher is better, and in this case better means more compatible with the binding fragments (and less compatible with the non-binding fragments, and ambivalent to functionality that was not present in the fragment dataset). This is a basic sanity check: adding a known active moiety should boost the score, and it does.
Underneath the prediction table is a button entitled Show Honeycomb, which is a whole lot of fun for anyone who is visually inclined (and as chemists we often are: the geometric diagrams that make up the hieroglyphs of our profession are probably one of the major reasons why many of us signed up for years of graduate school servitude).

The basic idea of the honeycombs is that it is a greedy visual clustering method. A certain compound is selected as the centre (in this case, the first or highest scoring user-entered compound from the prediction list). The diagram above is a bit zoomed out, but the white-on-black hexagon in the middle shows the fragment-grafted chloroquine derivative that I sketched previously. Around the central hexagon is plotted the 6 most similar compounds, in an orientation that maximises adjacent similarity. The remaining compounds are sorted by decreasing similarity and slotted into whichever position maximises similarity to neighbours, so as you pan the screen away from the middle, the compounds get less and less similar. From the planar geometry, you can often see clusters of like compounds clumped together.
The hexagons with a coloured turquoise outline are the fragments that bound to Mpro, so this can also serve as an activity landscape.
The last section on the site (as of early afternoon, 28 March 2020) is a list of proposed molecules, ranked by their score according to the fragment-based model:

I’m going to leave this section as a little bit of a teaser, since I intend to embellish on it over the next few days/hours. The compounds originate from another side project, which involves generating lists of reaction transforms from commonly available building blocks, using common and reliable reaction types (amide condensations, Suzuki couplings, click chemistry, that sort of thing). By collecting together a lot of starting materials + possible transforms, it becomes possible to combine them together in chemically plausible ways to generate a reasonable organic structure. The method of combination generates a reaction sequence implicitly, so it actually builds the synthesis as it goes (retro-retro-synthesis, if you like).
The workflow for generating these proposals involves starting with a random starting material then applying up to 4 random synthetic reactions (chosen from those which offer just one reactive site possibility), filtering (e.g. maximum molecular weight), then finally running through the prediction model and ranking the N-most high scoring compounds.
What you can see of these proposals at the moment is just the final assembled compound. Visually it does not show any metadata about the implied synthesis, but this is next on the list. It’s an easy enough addition (compared to how much work went into the rest of the machinery), and it should be coming up fairly soon. So if that sounds interesting, stay tuned.
I’ll follow up with more articles whenever new functionality is added to the page. At the very least I hope it provides some entertainment for however much more isolation is needed to flatten the curve, and if any of it looks interesting, don’t hesitate to get in touch.
