 The third app to implement a front end for the new general search capabilities is SAR Table. This one works a bit differently, because instead of offering the standard name/structure/substructure/similarity quartet, it offers a fifth type: searching by scaffold template. Continue reading
SAR table
SAR Table adding template creation from the matrix [view]
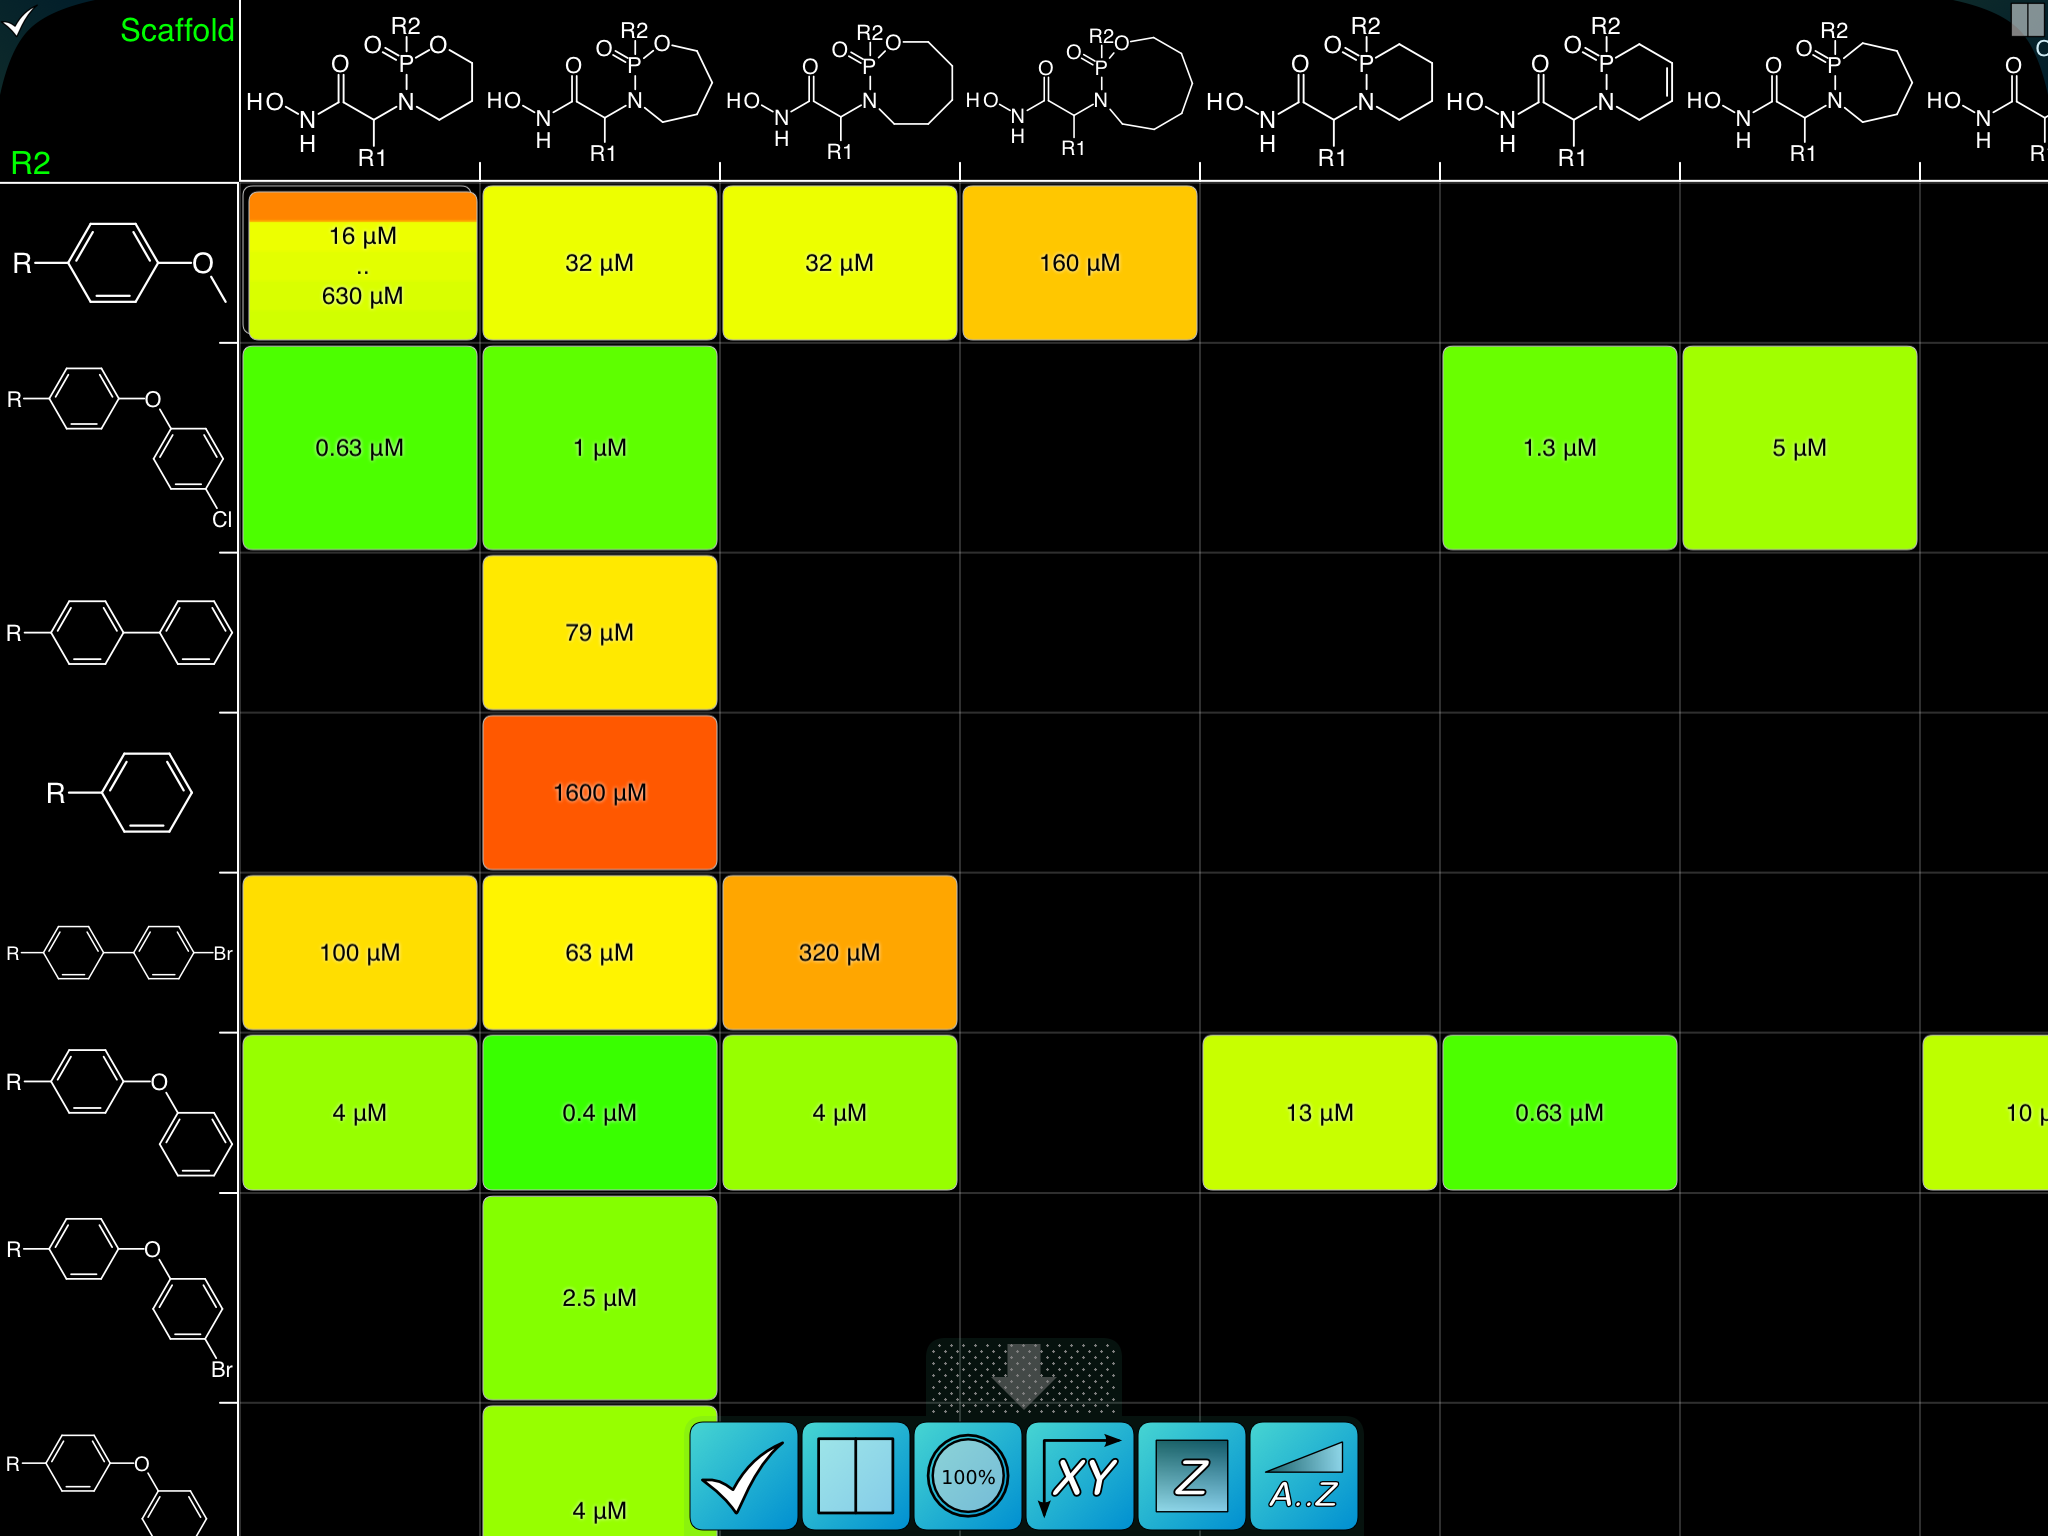 The SAR Table app is going through some major improvements at the moment. Earlier this year, the matrix view feature was introduced, which allows two properties (e.g. scaffold, R-groups) to be plotted against each other in a grid, with one or more properties represented with colour coding for easy recognition, such as shown on the top right. Continue reading
Model building, genetic algorithms and the SAR Table app
 Recent efforts on the subject of model building are getting close to fruition. As mentioned a few months back when I presented a CINF webinar, the SAR Table app has a not-yet-released feature which allows the current set of structures and their activities (“responses”) to be packed off to a webservice, which proceeds to construct a model based on structural features, then predicts values for any structures that don’t have values for that particular property. Continue reading
CINF webinar ‘Practical cheminformatics workflows with mobile apps’ now available
Check out the webinar now on YouTube. The talk consists of me doing a brief introduction to mobile chemistry apps, then going through a fictional, yet realistic, workflow example that involves searching for new tuberculosis drug candidates. The workflow includes a tour through several of the apps that I’ve created, or had a hand in creating. But enough spoilers, watch the video whenever you’re ready.
CINF webinar: sneak preview
 Next week I will be presenting a webinar, organised by ACS CINF (American Chemical Society, Chemical Information division). The title is Practical cheminformatics workflows with mobile apps, so if you have any interest in finding out where the state of the art is at, put aside thirty minutes and tune in.
The graphic shown on the right is a snippet from the upcoming presentation. It’s taken from the latest version of the SAR Table app, which introduces the ability to interface with a webservice that builds a structure-activity model based on available activity data, and predicts the missing values, which are shown as colour-coded half-squares. It’s still experimental, but it will be making an appearance in the workflow example next week.
Sneak preview: SAR Table matrix view
 The SAR Table app is currently undergoing surgery to add a major new feature: the matrix view, which allows two columns to be plotted against each other, e.g. R1 vs. R2. Cells at the intersection of two values are plotted with a colour/gradient that is indicative of the response, i.e. the activity. The sample snapshot to the right displays several activity values using the “heat map” colour scheme.
The new feature is in its early stages, and the visual feng shui will certainly mutate before the next release, but the core functionality is operational. Stay tuned for the next major version.
ACS Talk: Building a mobile app ecosystem for chemistry collaboration
The slides for my recent presentation at the American Chemical Society meeting in San Diego (Spring 2012):
The slides cover a whirlwind tour through some of the apps produced by Molecular Materials Informatics, showing how they can be used together in a realistic chemical information workflow.
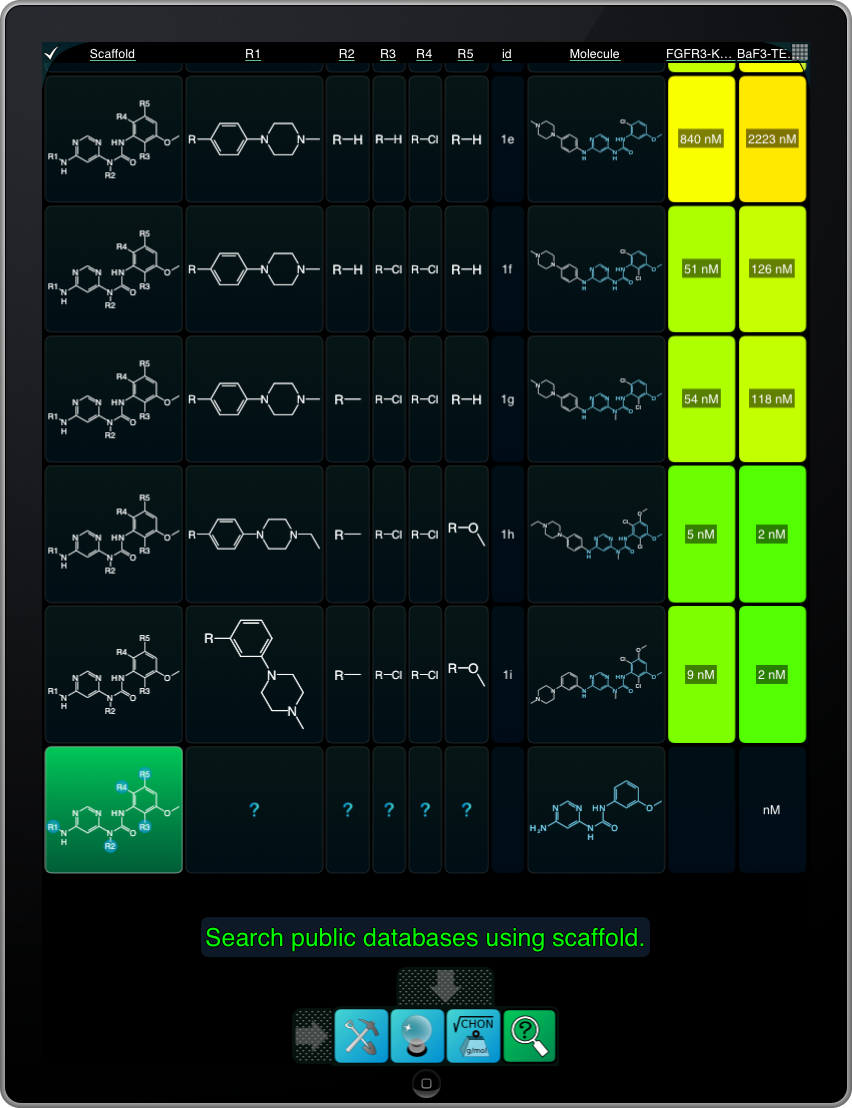
SAR Table app: now with scaffold substructure searching
Version 1.1 of the SAR Table app just passed review and is available on the iTunes AppStore. This release is an important one, because it adds a major new feature: scaffold matching. For a row which has a whole molecule defined, and a scaffold core, the scaffold matching algorithm can be invoked to figure out the substituents:

2011 redux
2011 has been a busy year for Molecular Materials Informatics, with new products, new features and new developments coming on hard and fast. 2012 begins tomorrow, and promises to keep up the same breakneck pace. This post is an executive summary of some of the news that was released over the year. Leaving out of course some of the projects that have yet to be unveiled.
At the beginning of 2011, there were just two products, with the same name: the Mobile Molecular DataSheet, or MMDS for short. Due to the rapidly shifting fortunes of mobile device platform makers, the iOS version for iPhone, iPod and iPad took centre stage in 2011, leaving the BlackBerry version behind. The iOS version was mostly feature complete by the beginning of 2011, having already added webservices access and reaction editing. Throughout 2011 the product has steadily matured, with a regimen of software updates adding minor and not-so-minor features, enhancements, bug fixes and ergonomic improvements.
SAR Table app: significant roster of new features
Version 1.0.2 of the SAR Table app has just come out on the iOS AppStore. This is a significant upgrade, since it introduces a number of features that have been planned all along, but were left out of the 1.0 release, in order to get a minimum viable product in place.
One of the most noticeable differences is an expanded command bank for editing SAR tables:

Most of the new features are described in the introductory tutorial, which has been updated for the new version. Continue reading
